Every winter Strava goes back through the ride data that their millions of users around the globe share on the social cycling platform. This year they’ve put together their 3rd annual End of Year Insights report looking into what trends, changes, and surprising facts pop out. With more than 9.6 activities shared every second over the last 12 months, that’s an 80% increase over last year, and clear sign that the if it’s not on Strava, it doesn’t count mentality is here to stay…
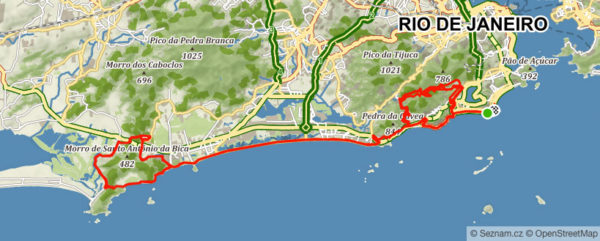
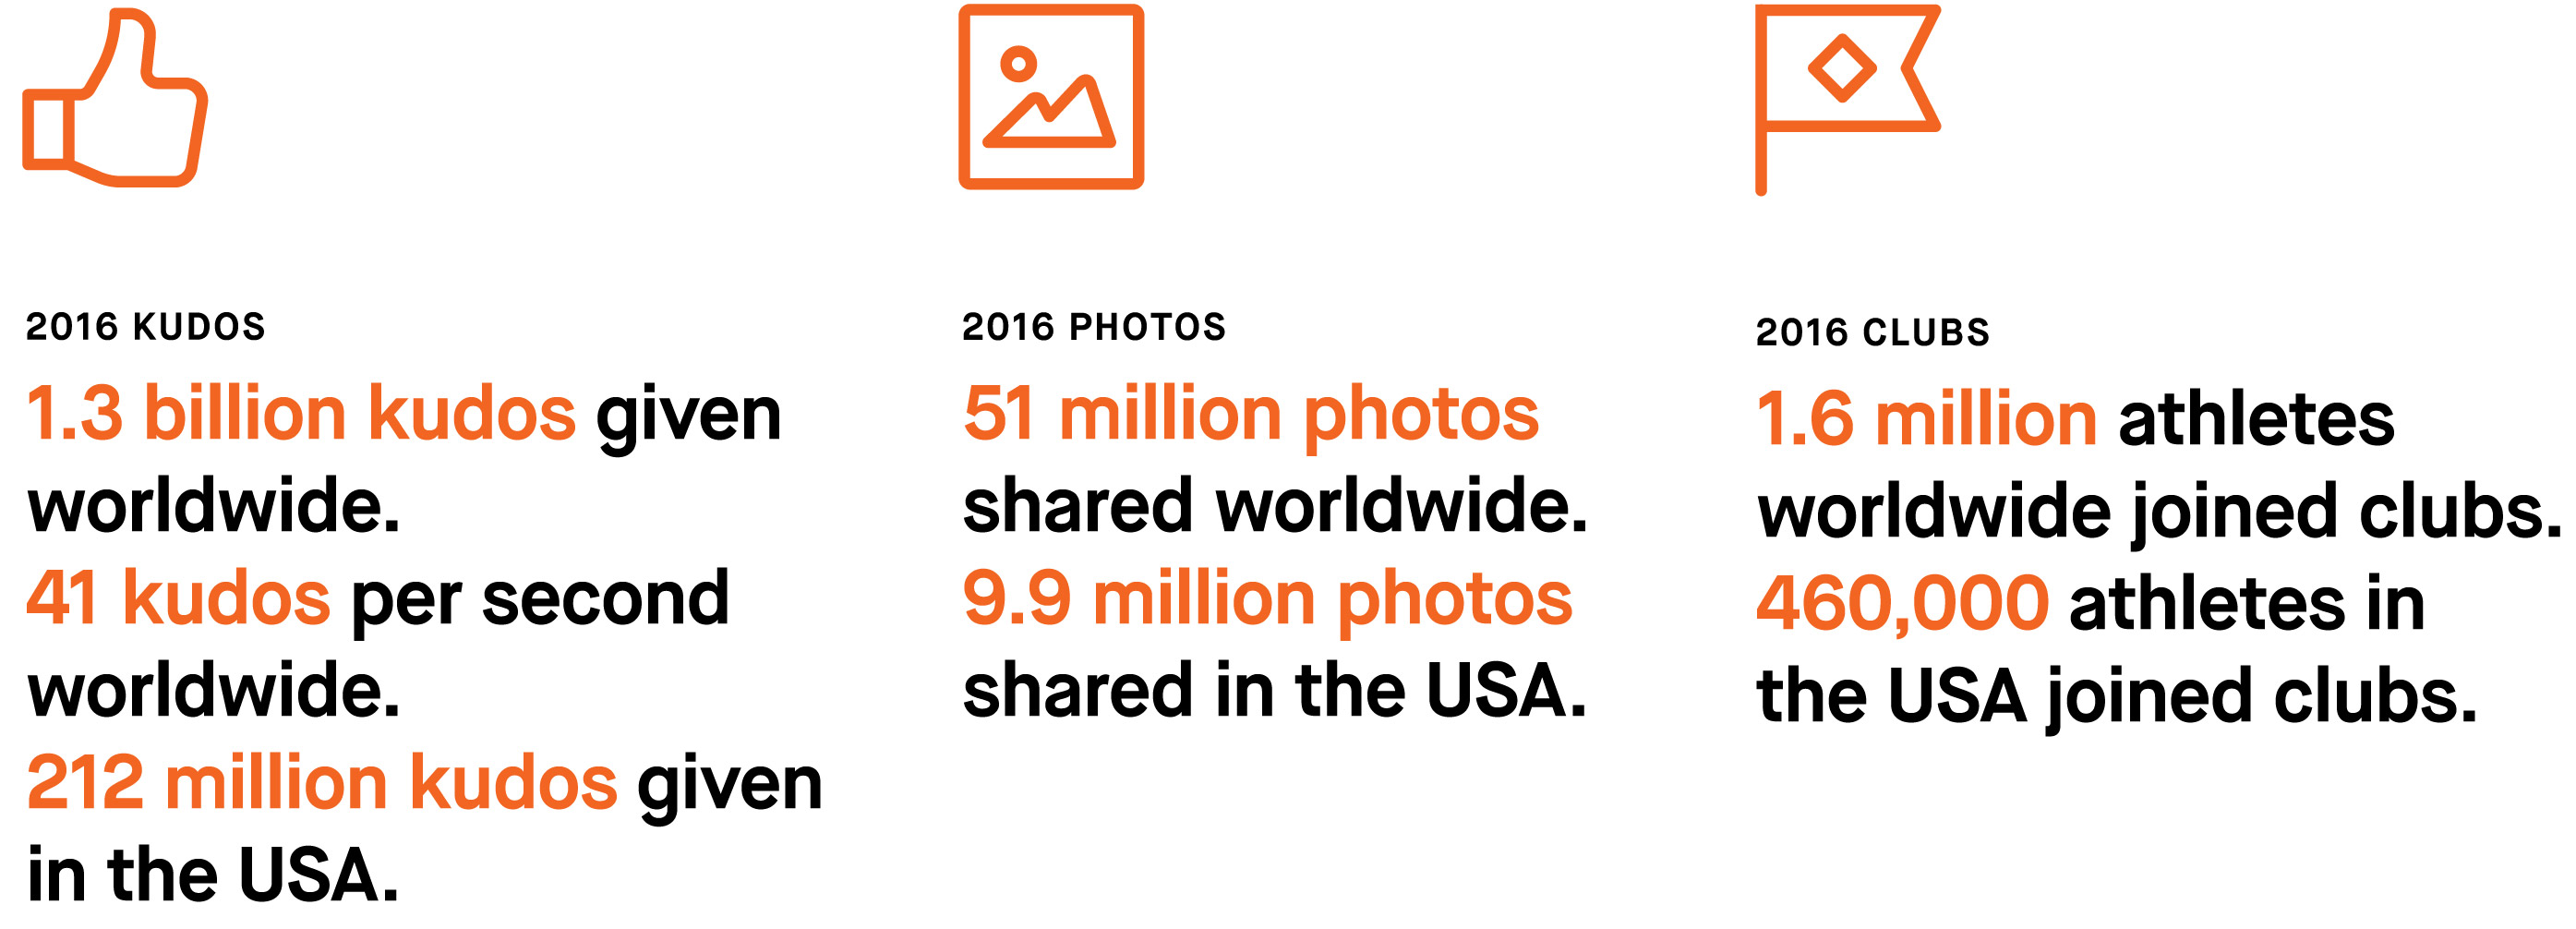
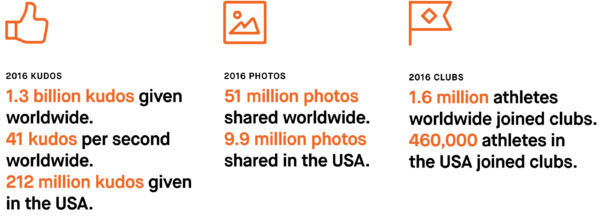
Strava prides itself on its Kudos as the true measure of the success of their social networking. Instead of just liking or sharing, you get to dole out props by giving each other kudos for rides that either stand out as exceptional or just merit the praise of your peers. In 2016, Strava saw 1.3 billion kudos given to each other worldwide, with Belgian Greg Van Avermaet pulling in the most on any single ride – currently 12,640 kudos – for his 6 hour, 231km gold medal winning men’s Olympic road race ride in Rio back in August. Yeah, I added one of my own for that one.
There are plenty of other metrics on which to judge a successful year for the cycling community. Globally, riders shared a total of 161 million rides over the last 12 months. The US where Strava was founded accounts for 32 million, or just less than 20% of that. In the states California takes the title for the most bike rides shared, and by a long shot with 7.8 million rides. I guess all that sunny warm weather helps, but so does a strong cycling scene and culture, giving them a wide margin over 2nd place and another beautiful place to ride Colorado with 1.8 and 3rd place Texas with 1.7 million activities. Looking state to state, interestingly the small state of Vermont came out with the hilliest average riding, while unsurprisingly Florida was the flattest.
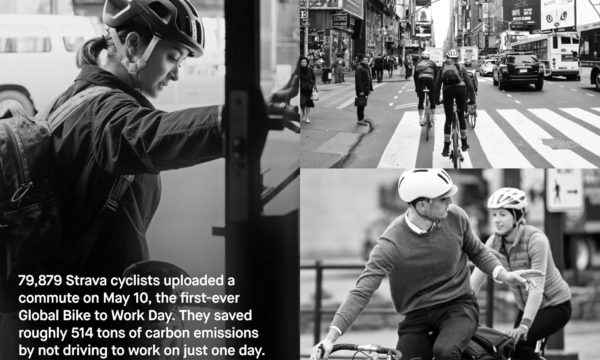
Across the US more than 127,000 rides got tagged each week as commutes, with an average distance of 8.3 miles ridden and 35 minutes to get to work. At the same time on the 10th of May, around the world 79,879 cyclists joined in to upload a commute for the first ever Global Bike to Work Day, which Strava helped promote. In that Bike to Work week, Americans clocked in the greatest number of rides in one day on May 12, a Thursday! Globally the most popular day to ride was September 11, which less surprisingly was a Sunday.
Overall for the course of 12 months Strava riders logged a total of 60,400 years worth of cumulative activity time. The data Strava uses for their year end analysis pulls from the start of Oct in 2015 through the same time this year so they can dig deep into the stats for an end of year look at things. There are way more stats than we can get into, so if you want to truly geek out on which US state has the highest average speed or what the difference in average climbing from men to women is per ride, feel free to dig into the full report from its DropBox link while it is there, or you can wait until December 20 when Strava’s blog will give the lowdown on even more achievements unlocked in 2016.
