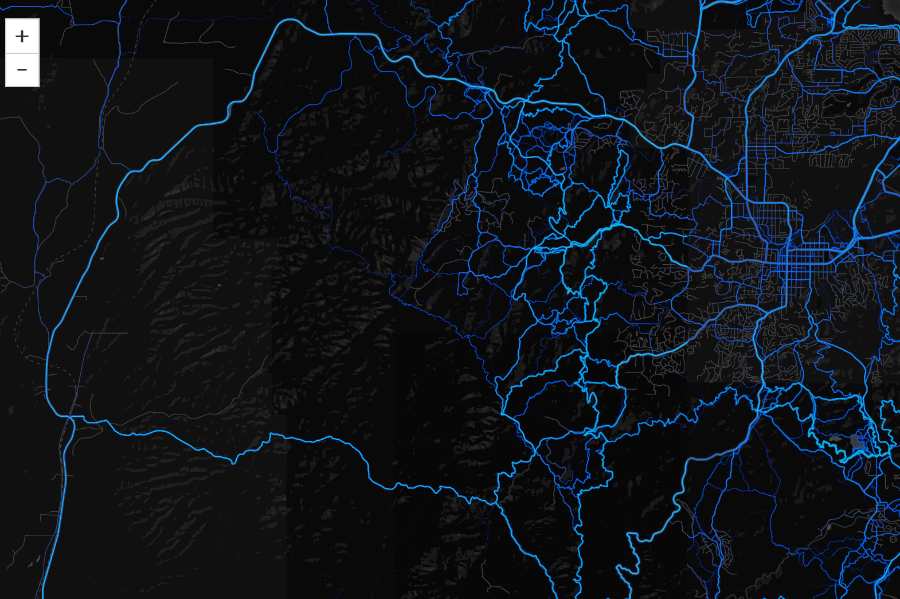
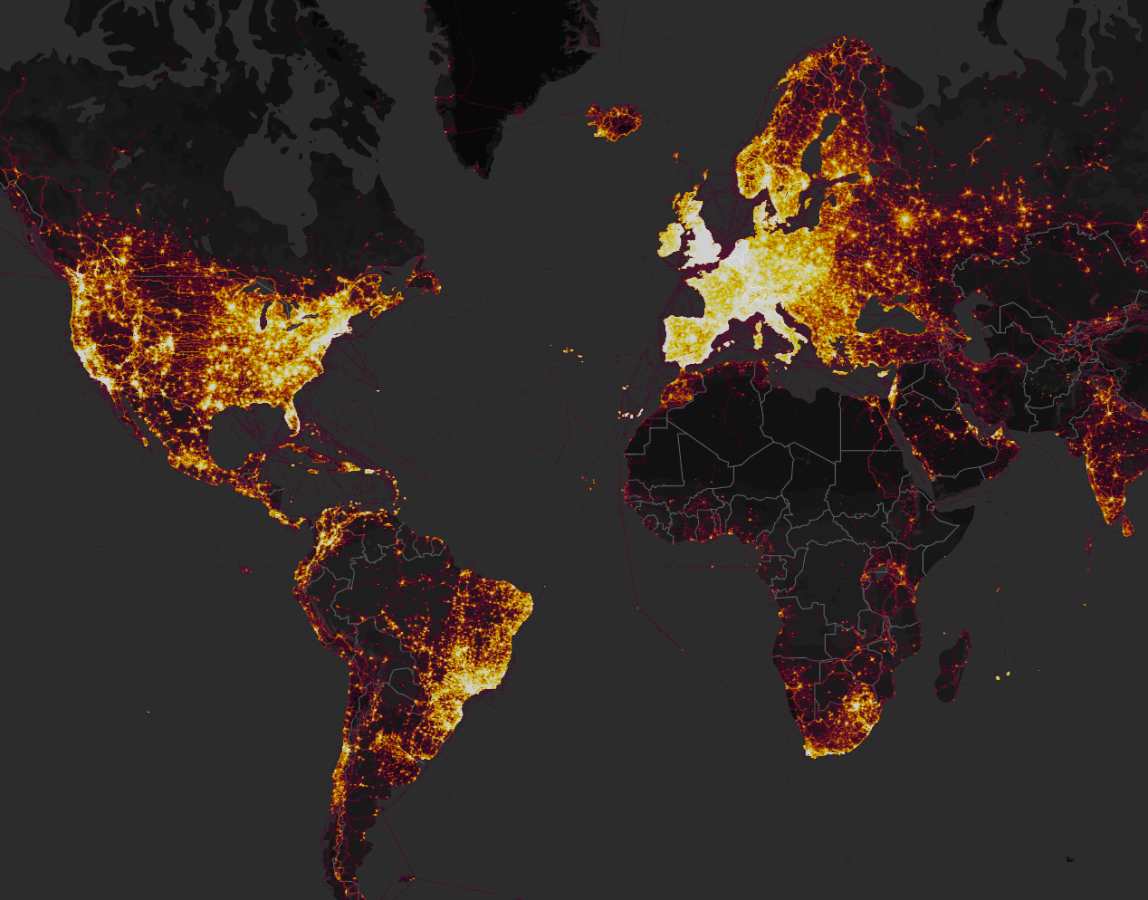
If you’re unaware of Strava’s influence in the world of athletic endeavors, their newly updated Global Heatmap makes for a powerful visual. Created to display all of the activities recorded by their extensive community of users, it’s a mind-bending amount of information and aggregates data gathered across 31 different activity types. Whether you run, ride, sea kayak, or backcountry ski, the new interactive map allows you to drill down to see where your fellow Strava members play.

In the time since the app first launched in 2009, Strava athletes have generated the equivalent of more than 200,000 years of recorded activity spanning 17 billion miles. If my math is correct, that’s 150 times greater than the distance to the sun. Every 40 days another million people join the community and by the time you finish reading this sentence 200 activities will have been uploaded.
As a planning tool, the Global Heatmap has more gee-whiz factor than practical application, but it can be used to generally locate popular roads and trails, particularly in places you may not know well. After poking around the map for my area, I could quickly spot our local mountain bike race course, a route traveled by 5,000 riders over the course of just one weekend every year. The interactive map is free, but Premium Strava members can access personalized information.


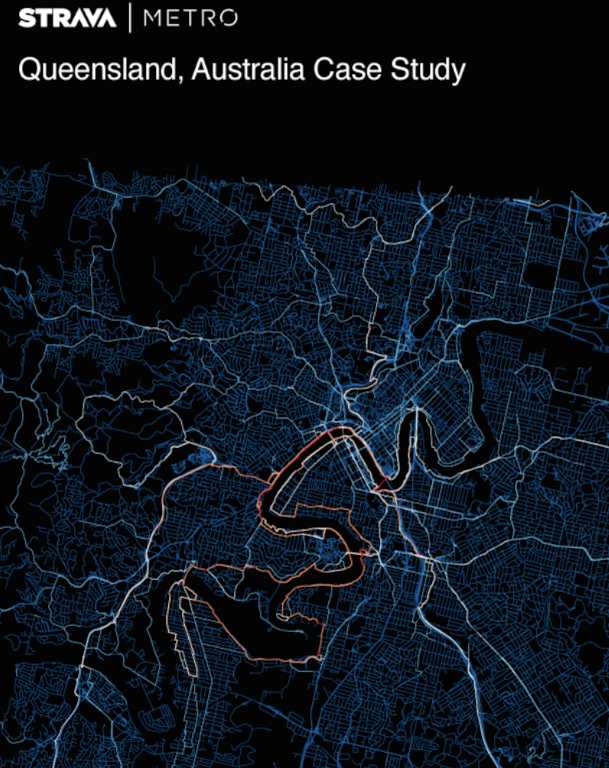
The real utility in the app stems from the crossover applications with Strava’s other tracker, Strava Metro. Like the Heatmap, Metro records user activities and formats the information specifically for use by transportation engineers and municipal planners to best maximize bike lanes and walking routes. That might be the best use of Strava collected data yet, not that we don’t love to snag a KOM/QOM now and then.
Curious how Strava started and has grown to this level? Listen to our podcast interview with co-founder Mark Gainey!
