The sports science software developers at Baron Biosystems have debuted a few new apps that add improved functionality and a bit of easy to read color to the newest crop of Garmin head units. Available through Garmin’s own Connect IQ app store the Xert system adds new live power data analysis tools to your existing GPS, including several new performance metrics that will help improve training and athletes a live data stream to help better time attacks and recovery in a race situation. Check out the details on the three separate apps, and Barons’s overall Xert power training program after the break…
Xert is built around a new perspective in looking at power data. Using a new metric – Maximal Power Available, or simply MPA – Baron is trying to establish how much power you have at the ready as you train and race. MPA is established from three standard power metrics: Threshold Power, High Intensity Energy and Peak Power. The Xert program combines them to form an individual Fitness Signature, on which they think they can better predict what you’ve got left in the tank.
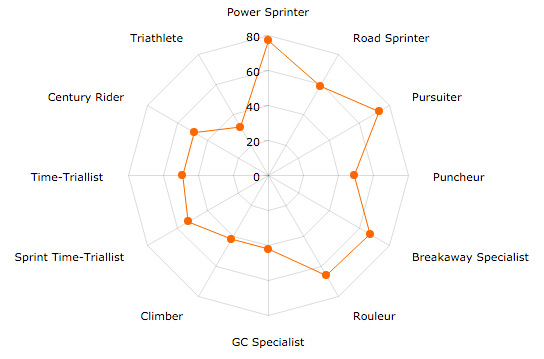
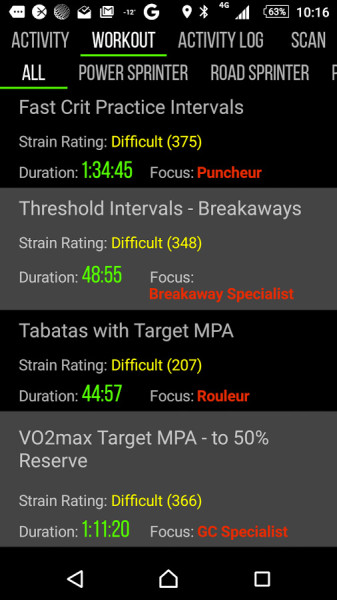
In this analysis then, Xert identifies your type of riding specialty and builds the unique Fitness Signature based on your power capabilities. With that data, the system can develop training plans to help you tune your style of riding or to improve on weaknesses. Based on MPA, Xert also thinks that this makes it easier for riders to monitor their progress through training, and does not require repeated FTP tests, since they can build your MPA out of the 3 inputs from single rides.
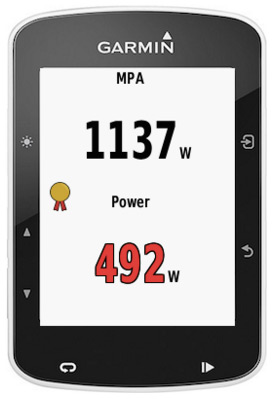
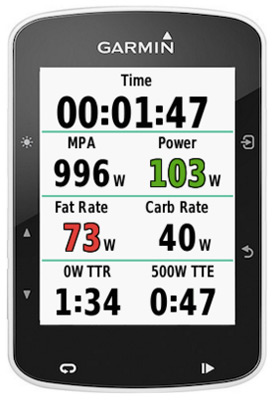
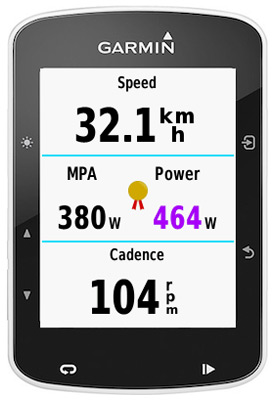 The new Garmin Edge GPS apps come in handy as they offer realtime feedback of these new metrics. Besides just showing the new MPA number, the app color codes power output so you can get a glimpse of how you are doing. Green is well below your threshold, blue just below, and white/black just above where you can sustain power output. Then you get to yellow which means that you have a max of 3 minutes until you are exhausted, red for 30 seconds to exhaustion, and purple when you go over your max power. It even gives you a little medal when you make a breakthrough.
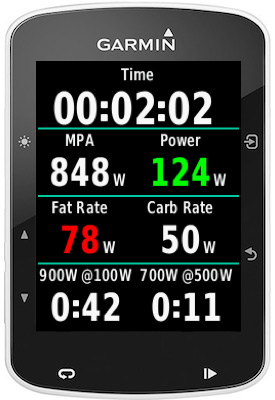
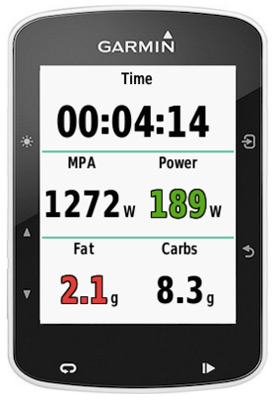
As for the other two apps, one provide color-coded fat and carbohydrate utilization estimates, based on your Fitness Signature, with red numbers indicating high fat burning and over threshold carb burning.
The last app calculates and displays live Time-to-Exhaustion (TTE) and Time-to-Recovery (TTR) figures. They are pretty self-explanatory to help gauge on the fly fatigue and recovery status. The TTE lets you setup a power level near your peak for a short sprint, near 5 min power for an attack; while TTR can be set for 0W for a coast down recovery, or to a wattage riding in the slipstream to recover in a pack.
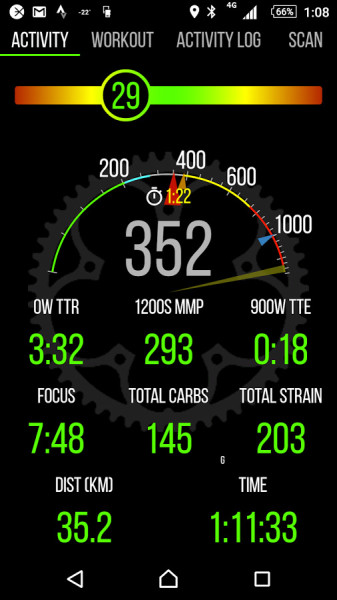
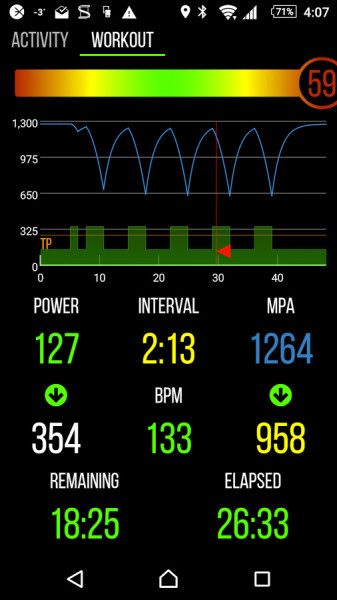
Baron says that all of this makes it easier to analyze your performance in each event you compete in, as well as compare your fitness over time. To get all of this functionality, you do need to get your data into Xert’s free online web app (free while it is still in Beta, plus one year for early adopters). To see it on your GPS, it’s going to need to be one of the newest generation Garmins (Edge 520, 820, or 1000) which now have app support. Or you can even use their powerful Android mobile app.
