If it’s not on Strava, did you really ride? At this point, that joke is getting pretty tired, but it captures the devotion that many have to the insanely popular ride tracking app. Whether gunning for KOMs or simply keeping track of your yearly mileage, the app can be a fun tool to add to your adventures. We likely don’t need to tell you that as Strava is recording 1 million new athletes per month in 195 different countries that are tracking 33 separate sports. All of that adds up to 19 million activities per week. That’s a lot of data, which Strava compiles into their annual Year in Sport report.
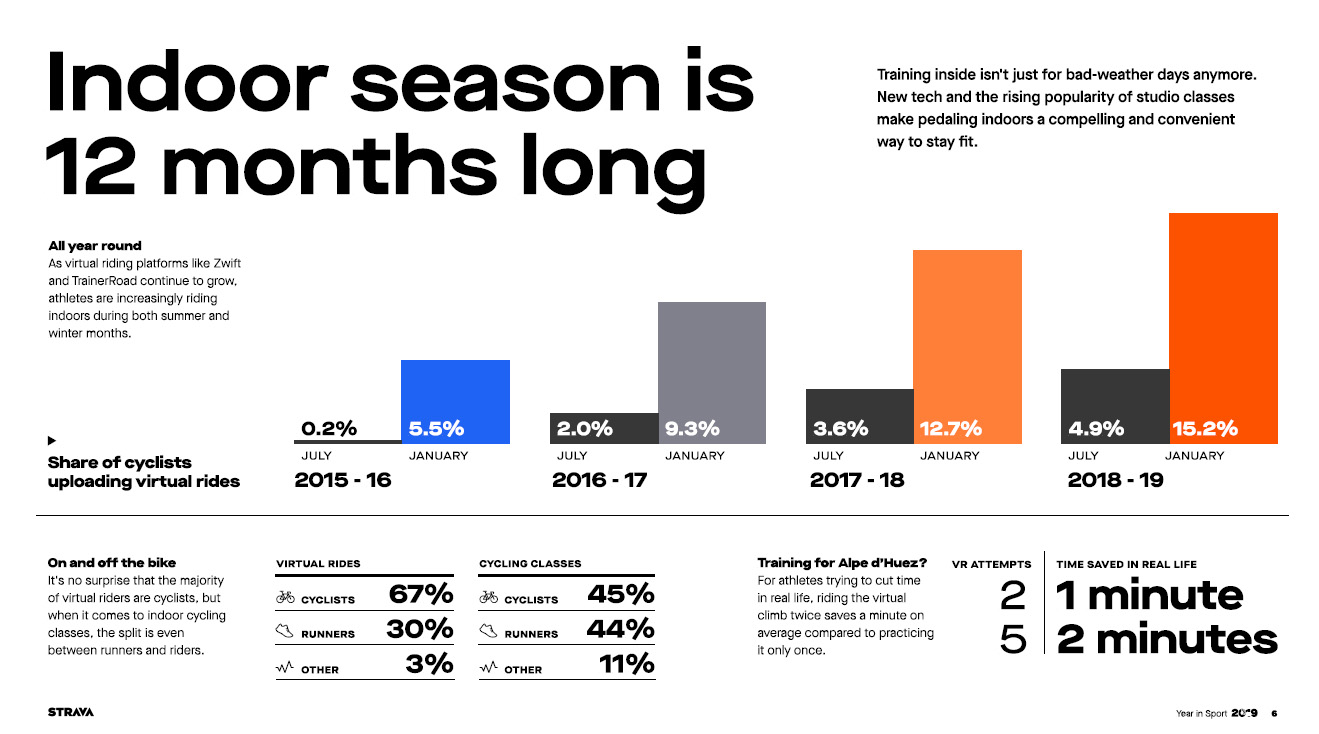
In 2019, there are some interesting metrics including the rise of indoor training – or at least the uploading of virtual rides. This doesn’t necessarily mean that more people are riding on trainers, but it does mean that more cyclists are uploading rides from apps like Zwift and TrainerRoad. Also, the volume of virtual rides continues to increase in both January and July, though January still reigns supreme for virtual rides.
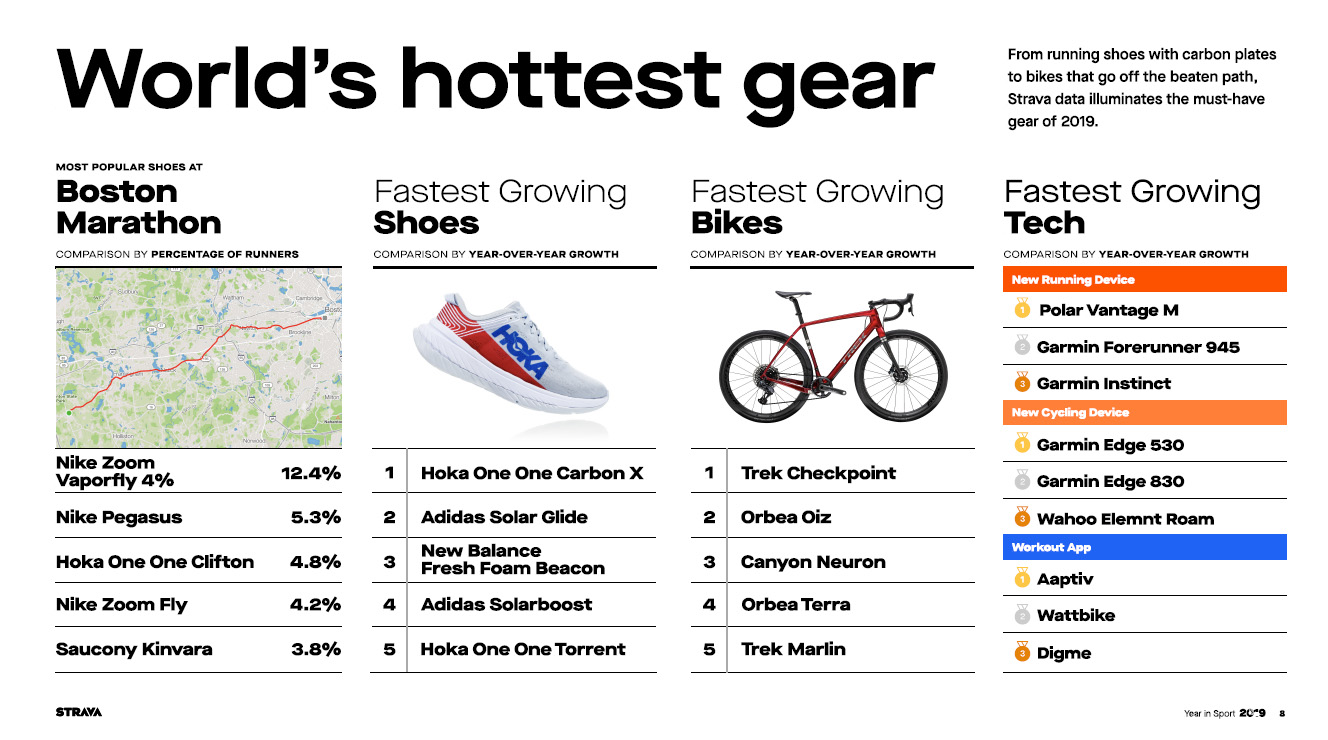
To be honest, I can’t remember the last time I added any gear selections to activities or the app in general, but that clearly isn’t the case for everyone. For those that do include their bike of choice, the Trek Checkpoint is the fastest growing bike for year-over-year growth. But as mentioned, that could just mean that owners of Trek Checkpoints are more likely to include their ride within the app.
The report goes on to examine the most common start times of group rides vs. all others, the secrets of motivation, gender parity in commuting, the effect of Daylight Savings on activities, and more. It’s a bit hard to comprehend, but Strava users have recorded 5.6 billion (with a ‘b’) miles and 296.7 billion feet of elevation gain.
To see the whole report, check it out here.


