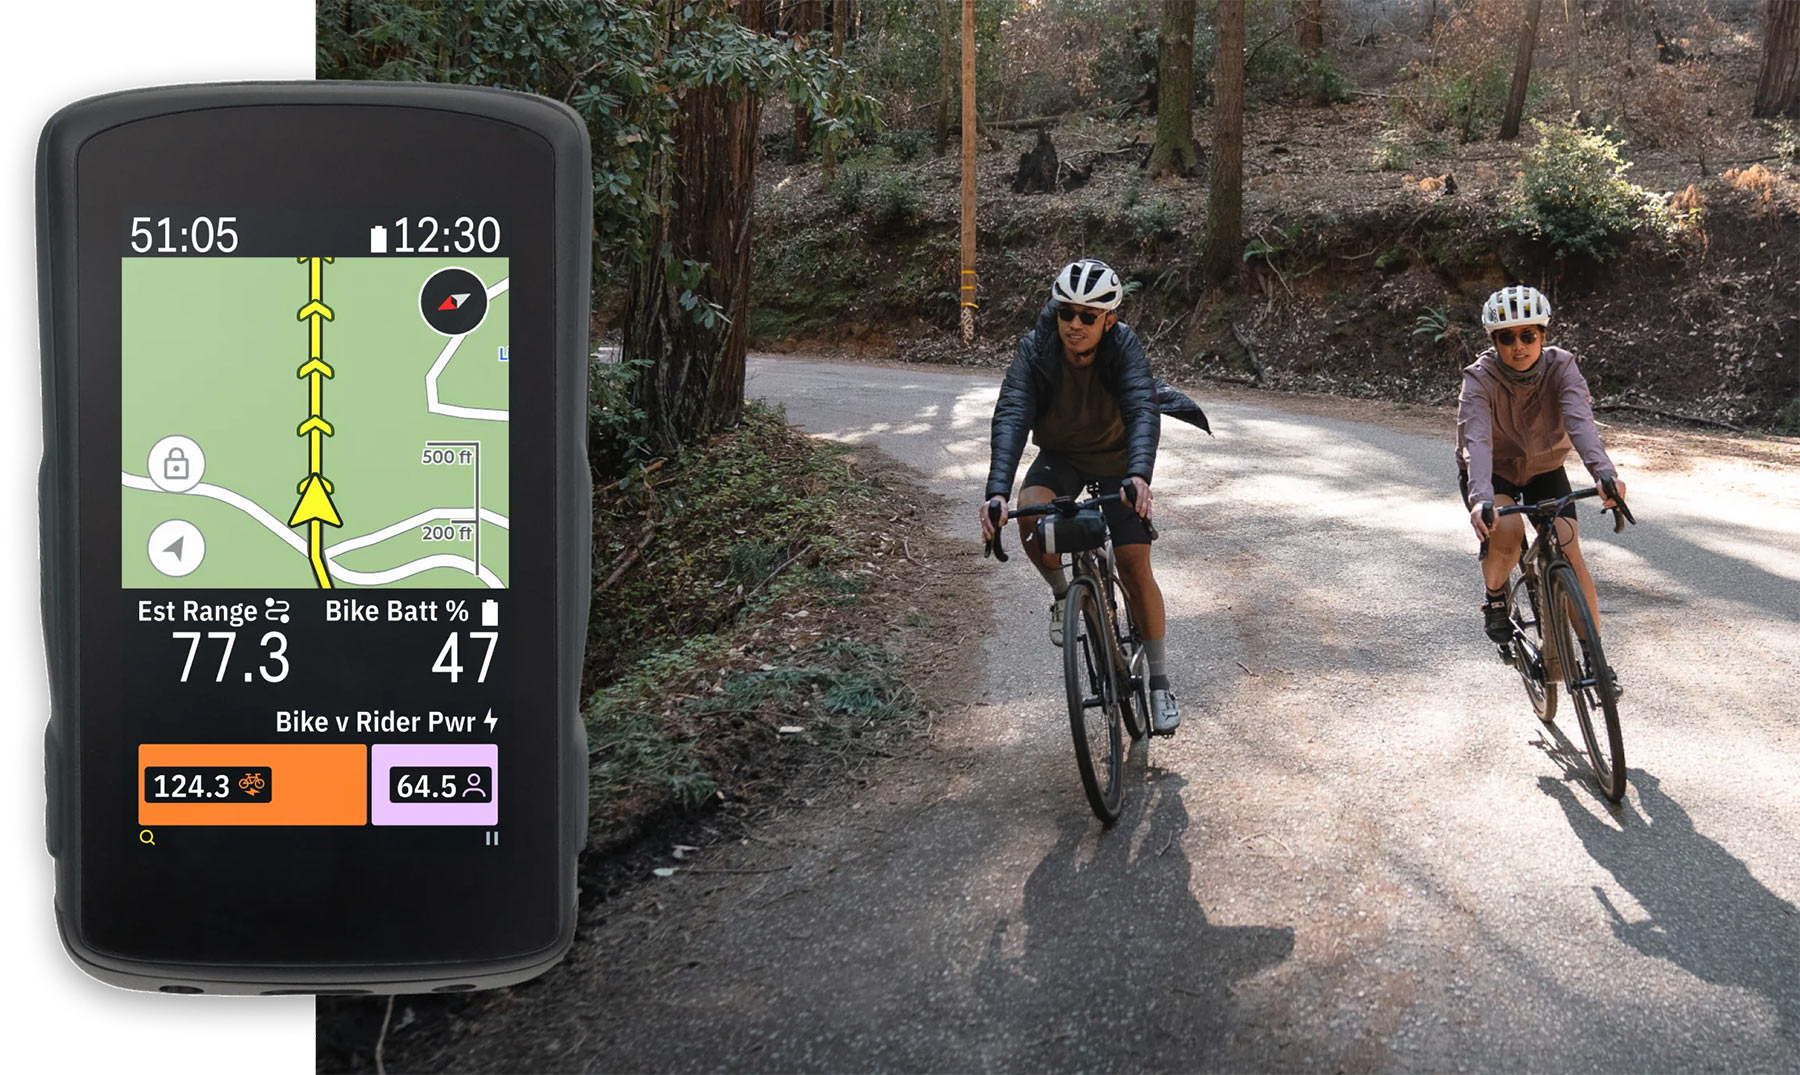
The latest Hammerhead Karoo 2 update brings some really cool e-bike graphics and data onto its screen. Compatible ANT+ LEV e-bikes can now send battery usage data to the cycling computer, which then combines that data with your ride data to produce color charts and graphs to help you see how you’re using the bike’s juice.
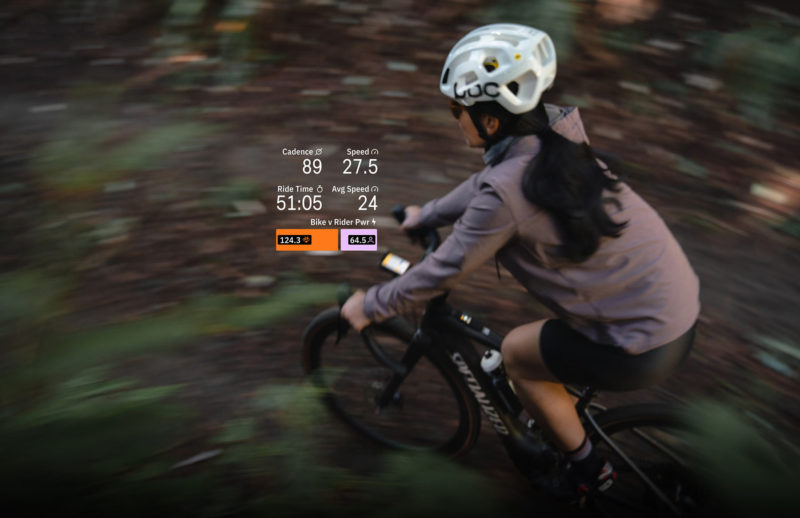
One of the funner ones is showing how your output compares to the bikes. A two-tone Bike v. Rider graph adjusts to show how many watts each of you is putting out at any given point.
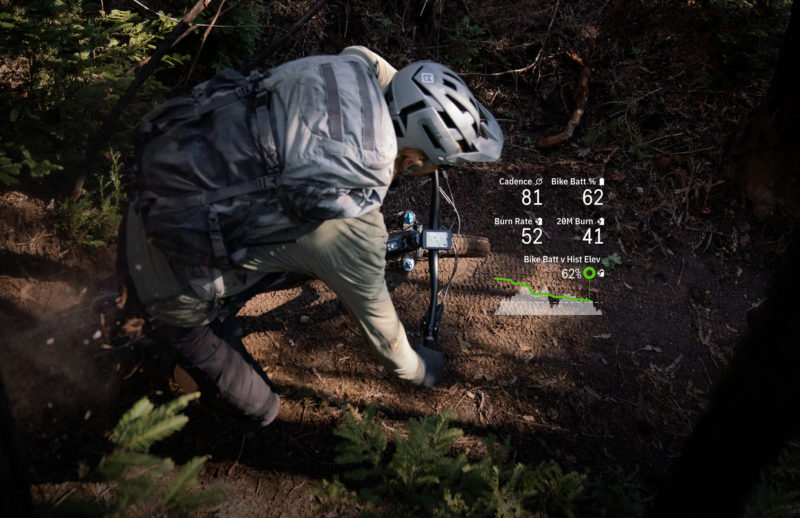
For mountain bikers, a Battery Level v. Elevation shows how the battery drops laid over an elevation profile of your ride.
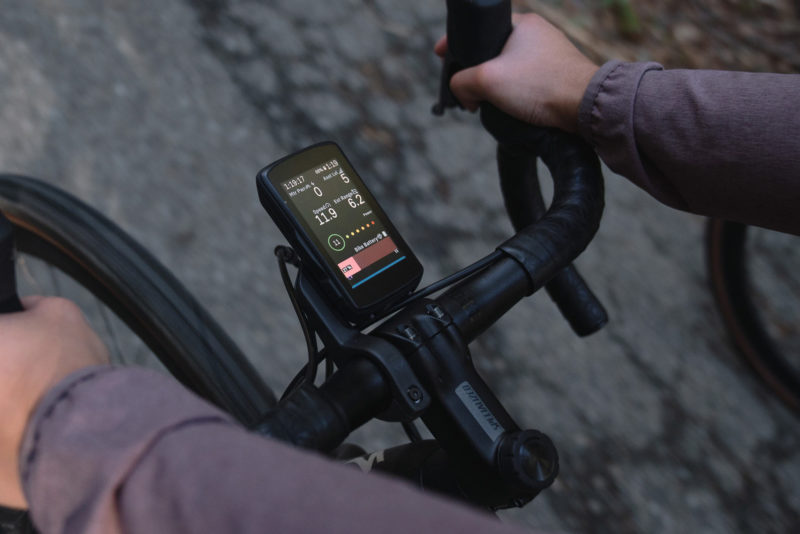
The full list of data points captured by the Karoo are:
- Battery Life
- Range Remaining Vs. Route Distance Remaining
- Battery Burn Rate
- Estimated Range Remaining
- Assist Mode/Level
- Bike Motor Power & Combined Power
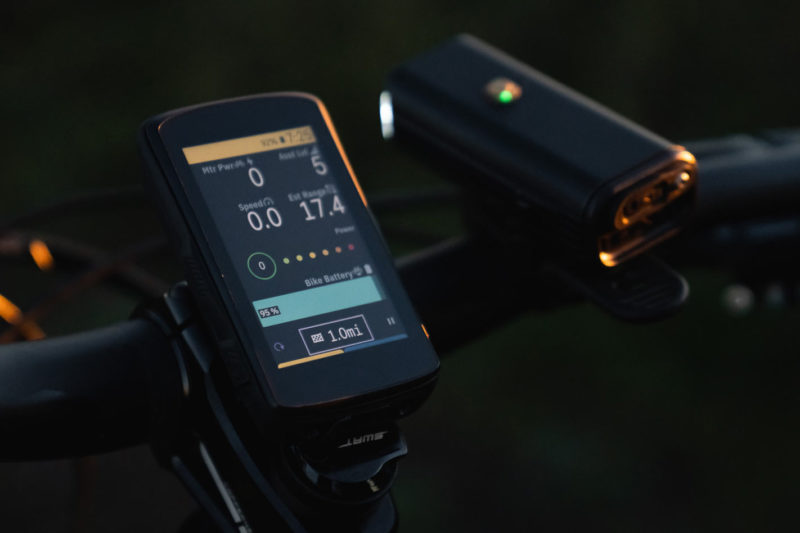
More than just numbers (although you can add those as pure numerical data fields, too), the graphics make it quick and easy to visualize remaining battery and range at a glance, even if the terrain is a bit bumpy for reading actual numbers.
After the ride, you can analyze battery usage, drain rate, and assist level along a route map within your Hammerhead dashboard on a desktop.
Not all of these features will work on every bike, as your e-bike will need certain features to show some of the data points (like Rider power). And not every ANT+ LEV bike is fully compatible. But for those that are, like the latest Specialized Turbo models, this looks fun.
