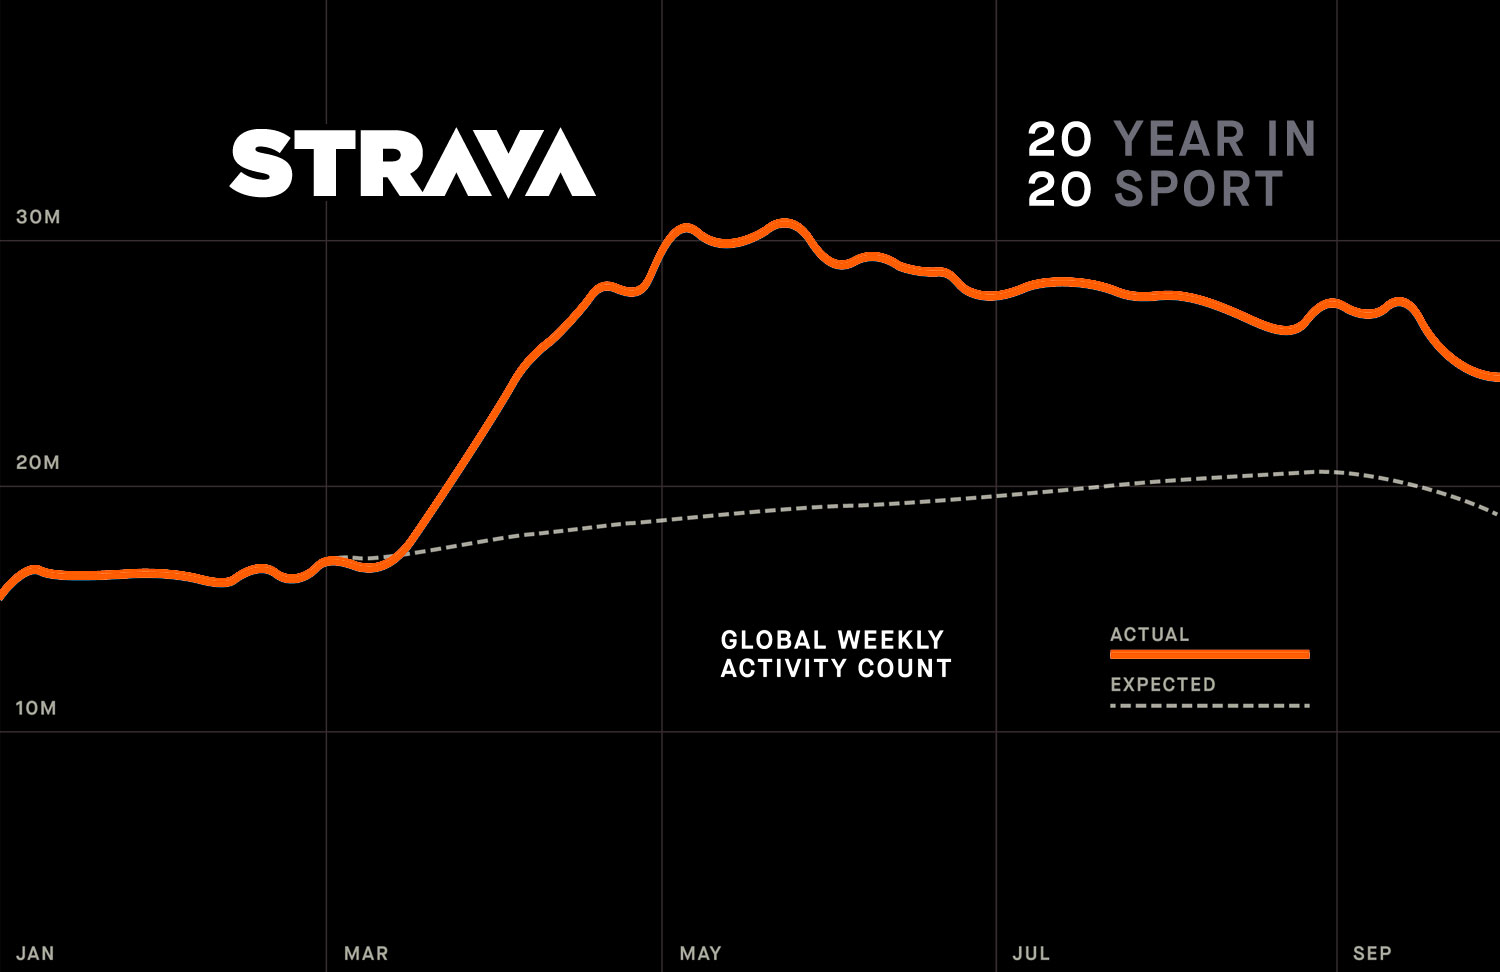
This year has been wild, but even in the year of the COVID-19 pandemic 73 million athletes logged 1.1 billion activities over 10.6 billion miles on Strava, and many of us reimagined how to be active – during national lockdowns, on solo or socially-distant rides, or even indoors. Maybe not so surprising, the biggest takeaway from Strava’s 2020 Year in Sport data dump is just how much we all turned to exercise to take out minds off the world on fire.
Strava 2020 Year in Sport data uncovers active lifestyle in a pandemic
Every year, Strava digs through all of our collective activity data to identify the trends of amateur and pro athletes alike. And while 2020 has been totally defined COVID-19 globally through shutdowns and rules that vary from place to place, the overarching trend is still that athletes have adapted and actually created an Exercise Boom.
Strava 2020 looks at trends in their data from years past, projecting what they anticipate for the coming year. And a whole, we exceeded their expectations even in trying times. In fact, they say that athletes who were active on Strava in both 2019 and 2020 increased their activity frequency & duration.
Dealing with exercise restrictions around the world
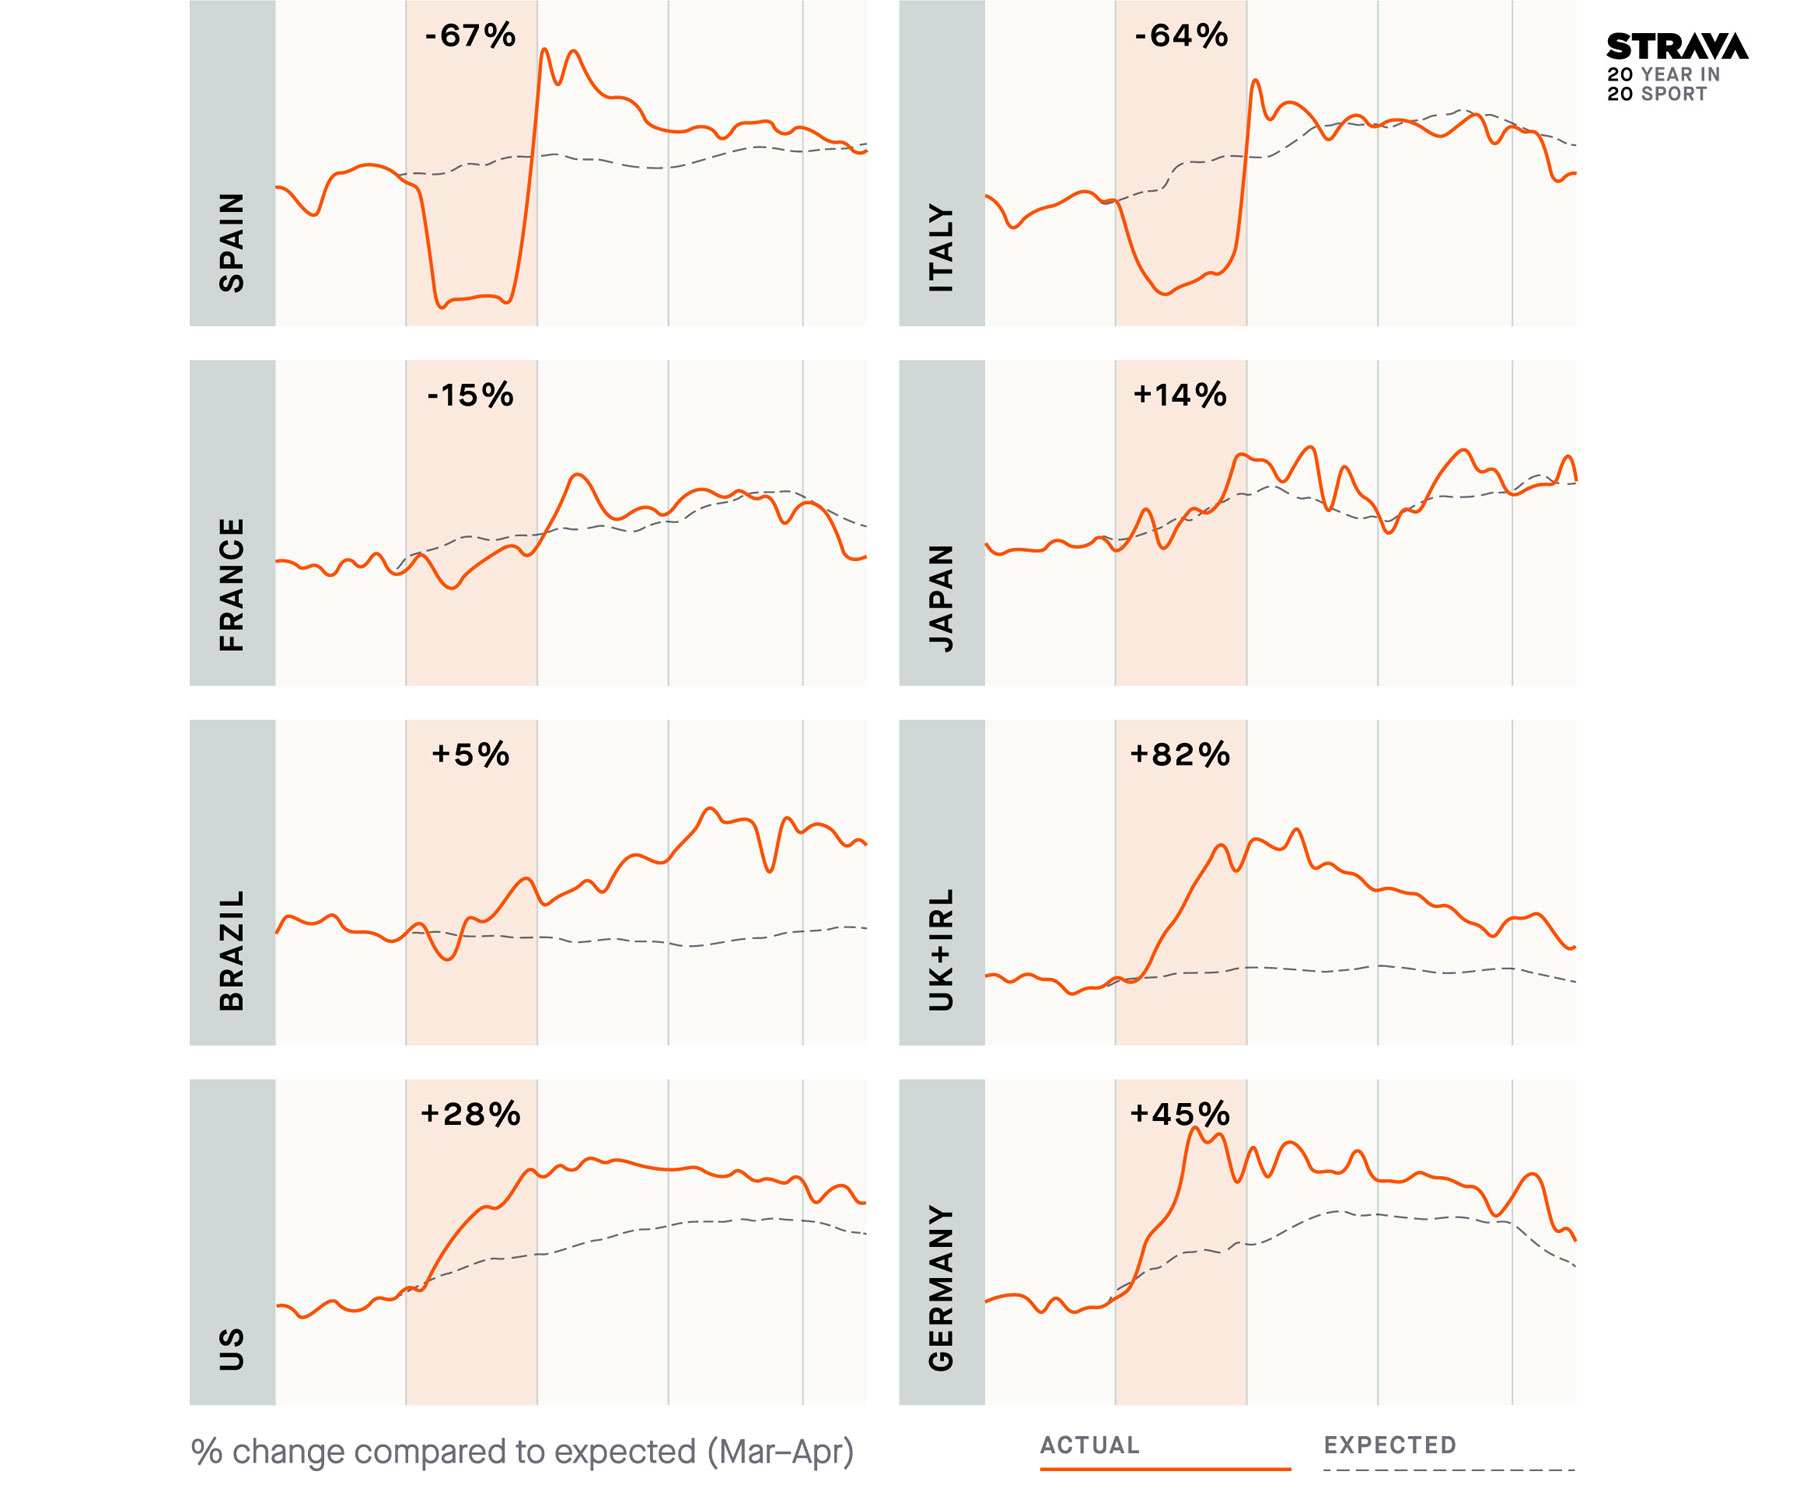
What is just as obvious though, when looking at country-by-country data, athletes around the world adapted to COVID-19 restrictions differently.
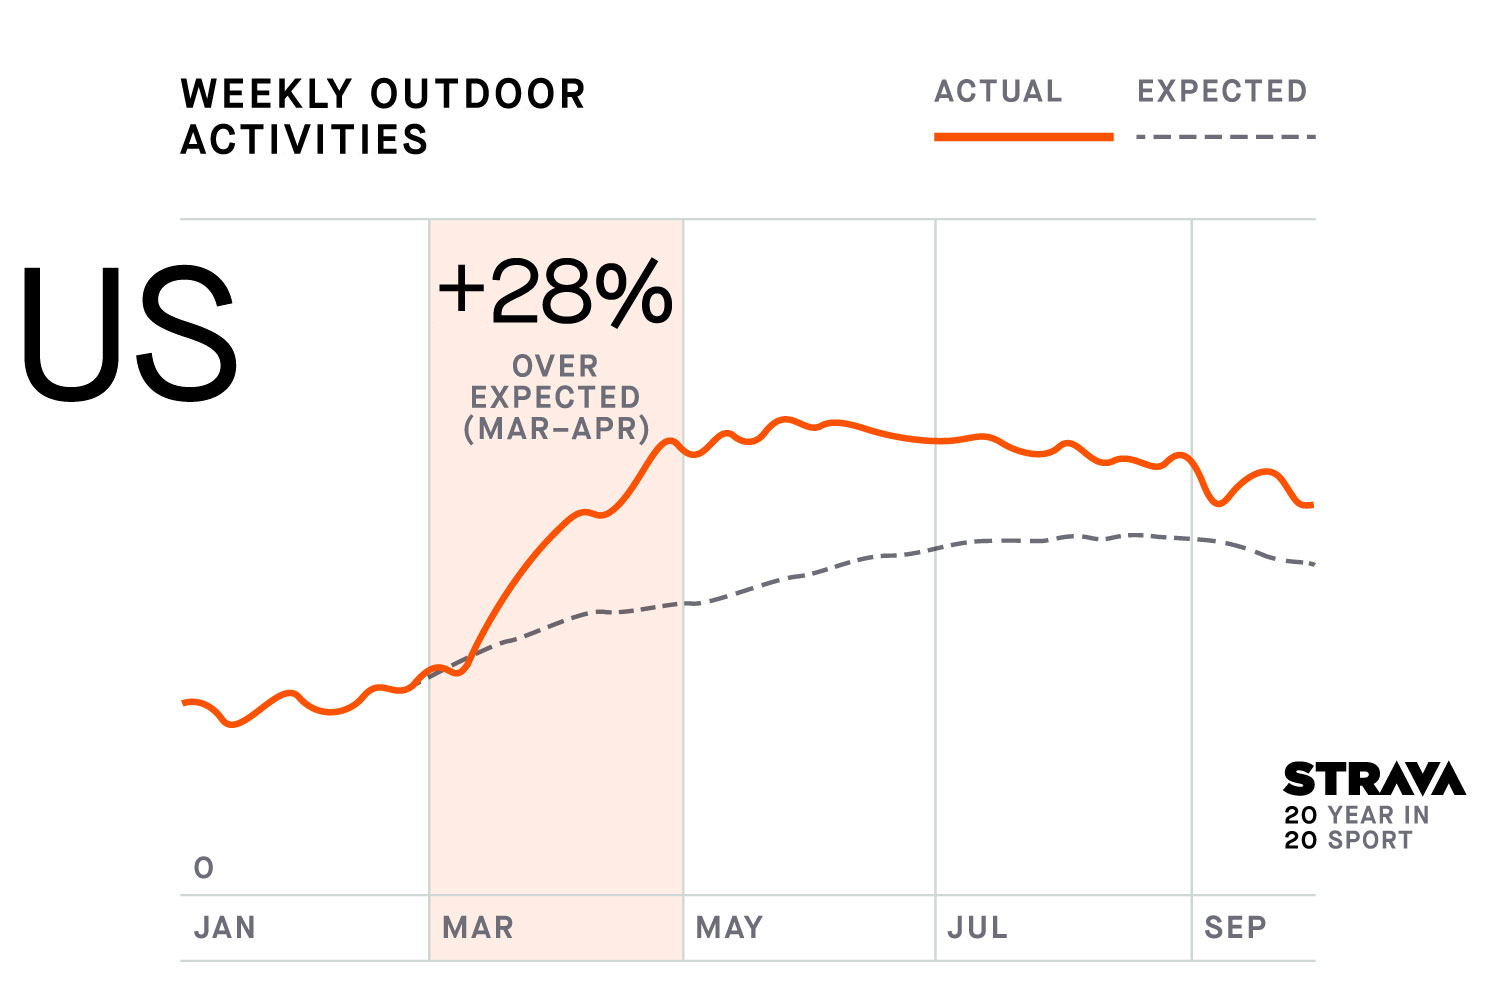
Impacts to the US – as well as Germany, the UK & Ireland in Strava’s data set – were unique in that with less regulation or limitation on outdoor activity, runners & cyclists increasingly headed out to exercise, using sport as a healthy escape. Also with indoor gym restrictions, riding outside just seemed like a safer way to stay fit. Plus, a ton of new people got on bikes or started running.
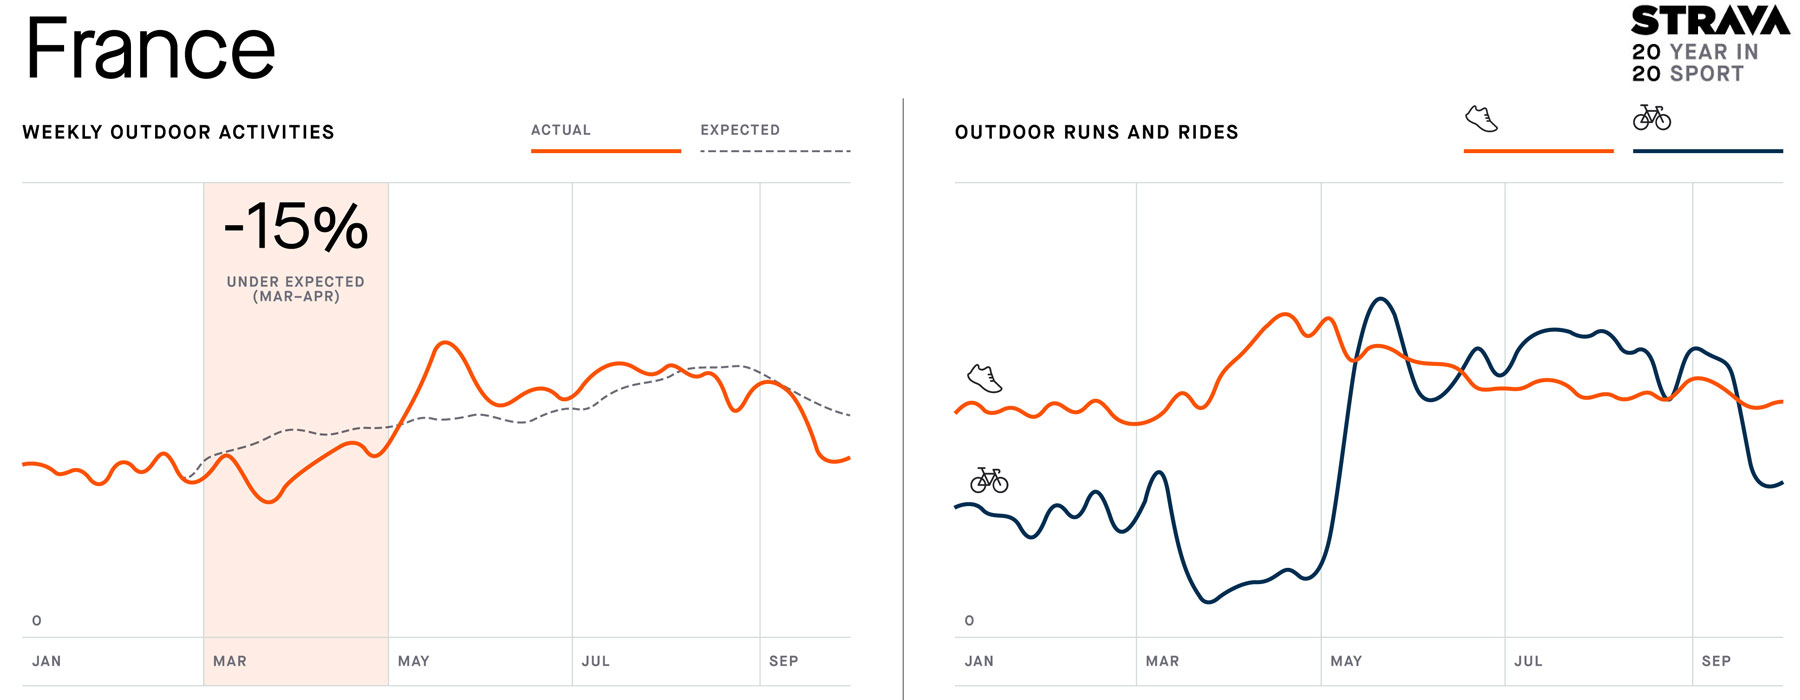
A number of countries like France got exercise distance & time restrictions. Cut down to one hour of activity, a limited to staying within one kilometer of home, many French athletes parked their bikes for the months of March & April, and went out running instead.
And of course many just took up indoor activities like riding the trainer on Zwift. But again, not surprising the 3.9x Spanish, 3.3x Italian & 2.5x French boosts in indoor activity dropped back almost immediately to normal once restrictions got lifted and cyclists could head back outside to train in the fresh air again.
All of that would have been pretty easy to predict I think, based on variation of restrictions and our desire to ride outside as much as possible in the summer, but…
Women’s Exercise Boom!
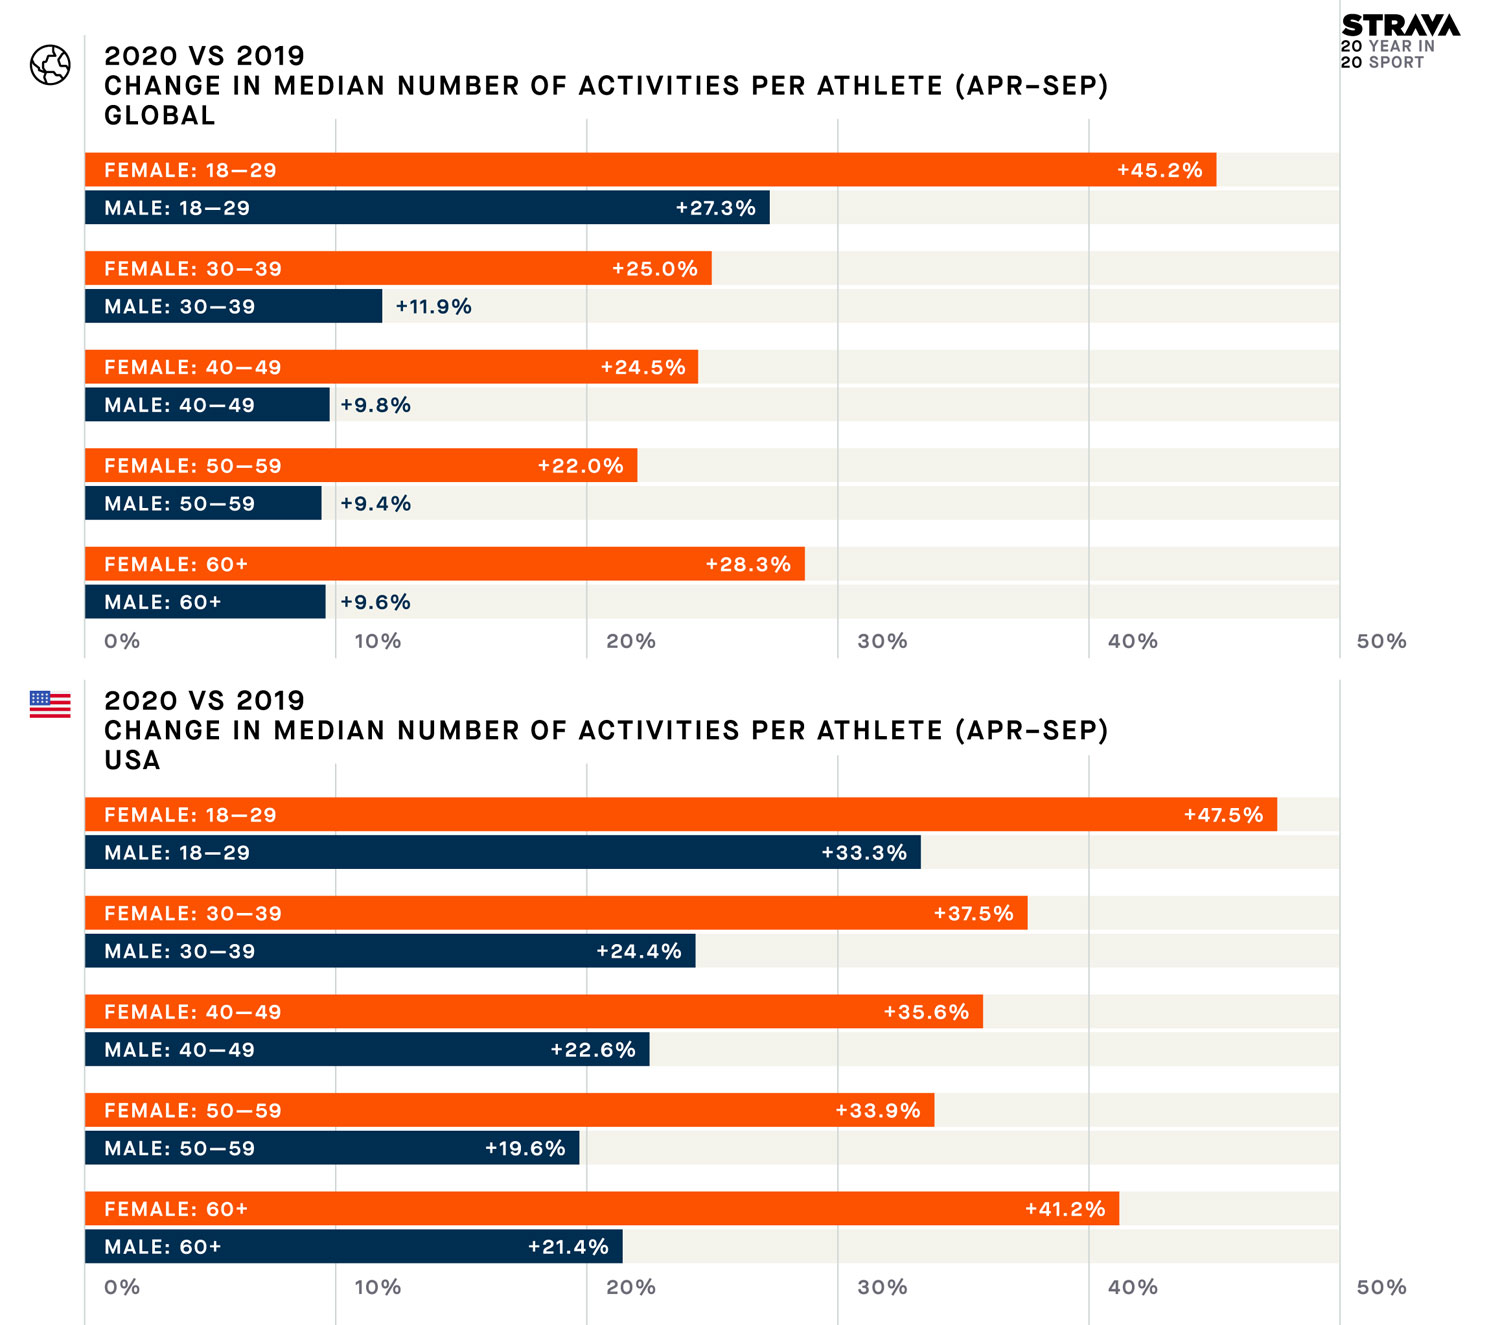
But maybe most surprising was just how much more women increased their exercise regimen than men. Across ALL age groups women really stepped up their activity levels this year.
Between April and September, women aged 18-29 uploaded 45.2% more activities than during the same period the previous year, compared to a 27.3% increase by their male counterparts. Were they trying to get away from us annoying guys stuck inside talking about Zwift or taking KOMs? Who can say!
Strava 2020 Competition – against yourself & the community
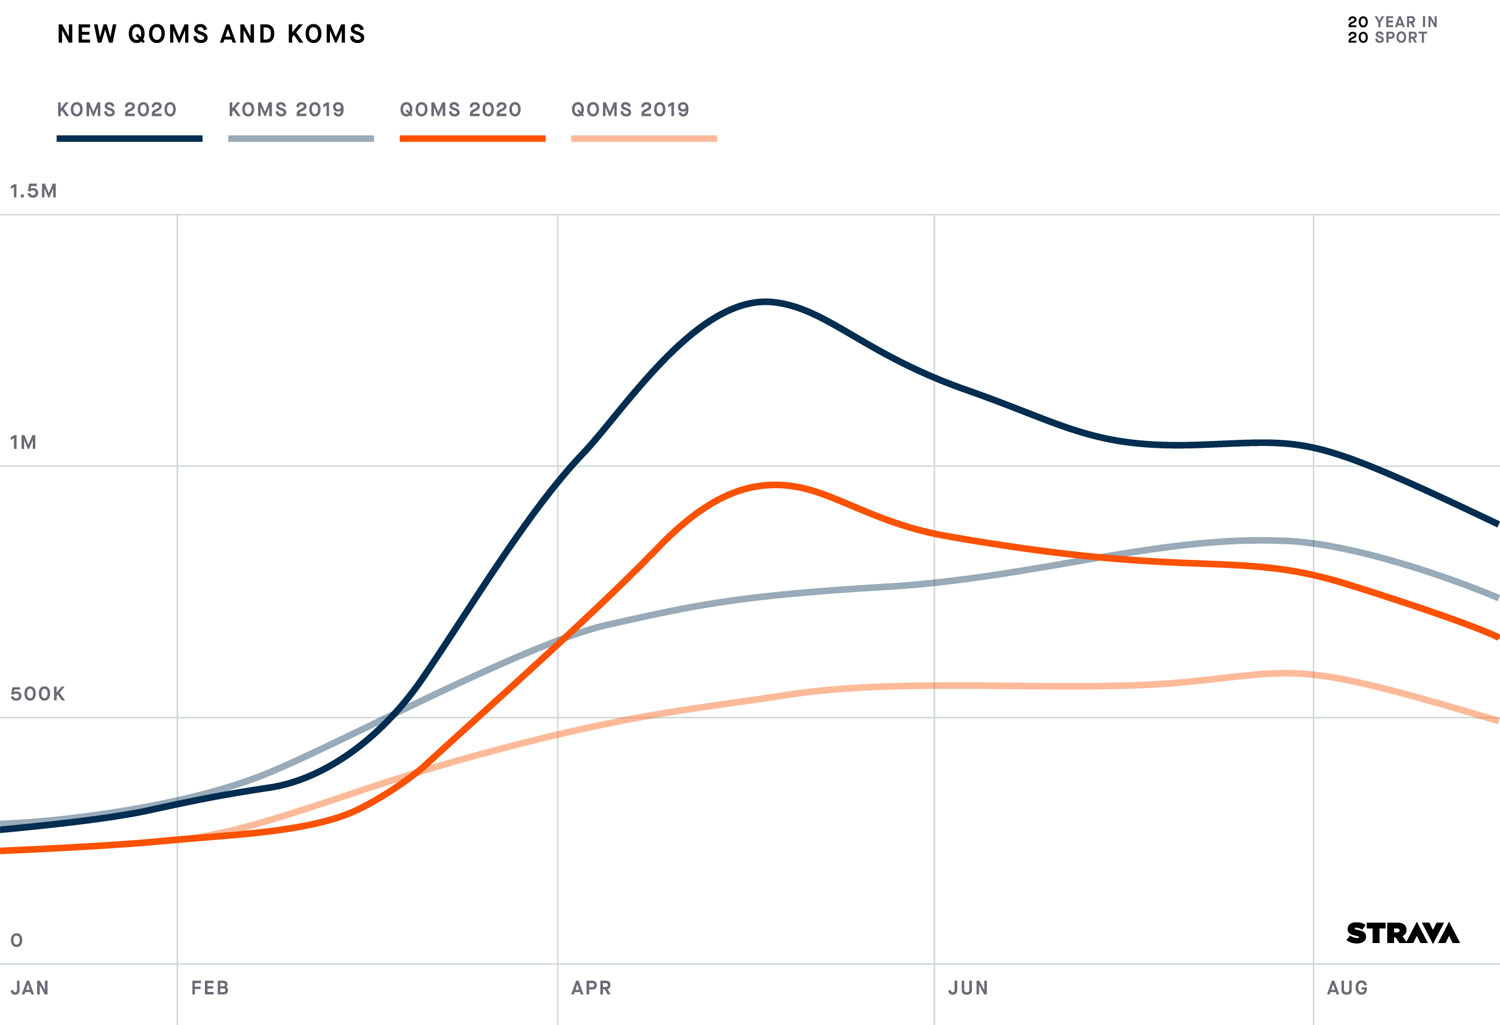
Speaking of KOMs & QOMs, with real-world in-person competition pretty much ground to a complete halt with the cancellation of the vast majority of races and mass start events, Strava became an even better tool for gauging our efforts. Strava says 36% more QOMs & 32% more KOMs changed hands this year as riders fought over Strava Segment bragging rights.
Apparently the virtual competition & peer pressure to stay active extended beyond the segment. This year if you looked at the top two riders on any KOM/QOM leader board, there was a 27% chance they would be following each other – sharing activities in each other’s daily feeds as motivation.
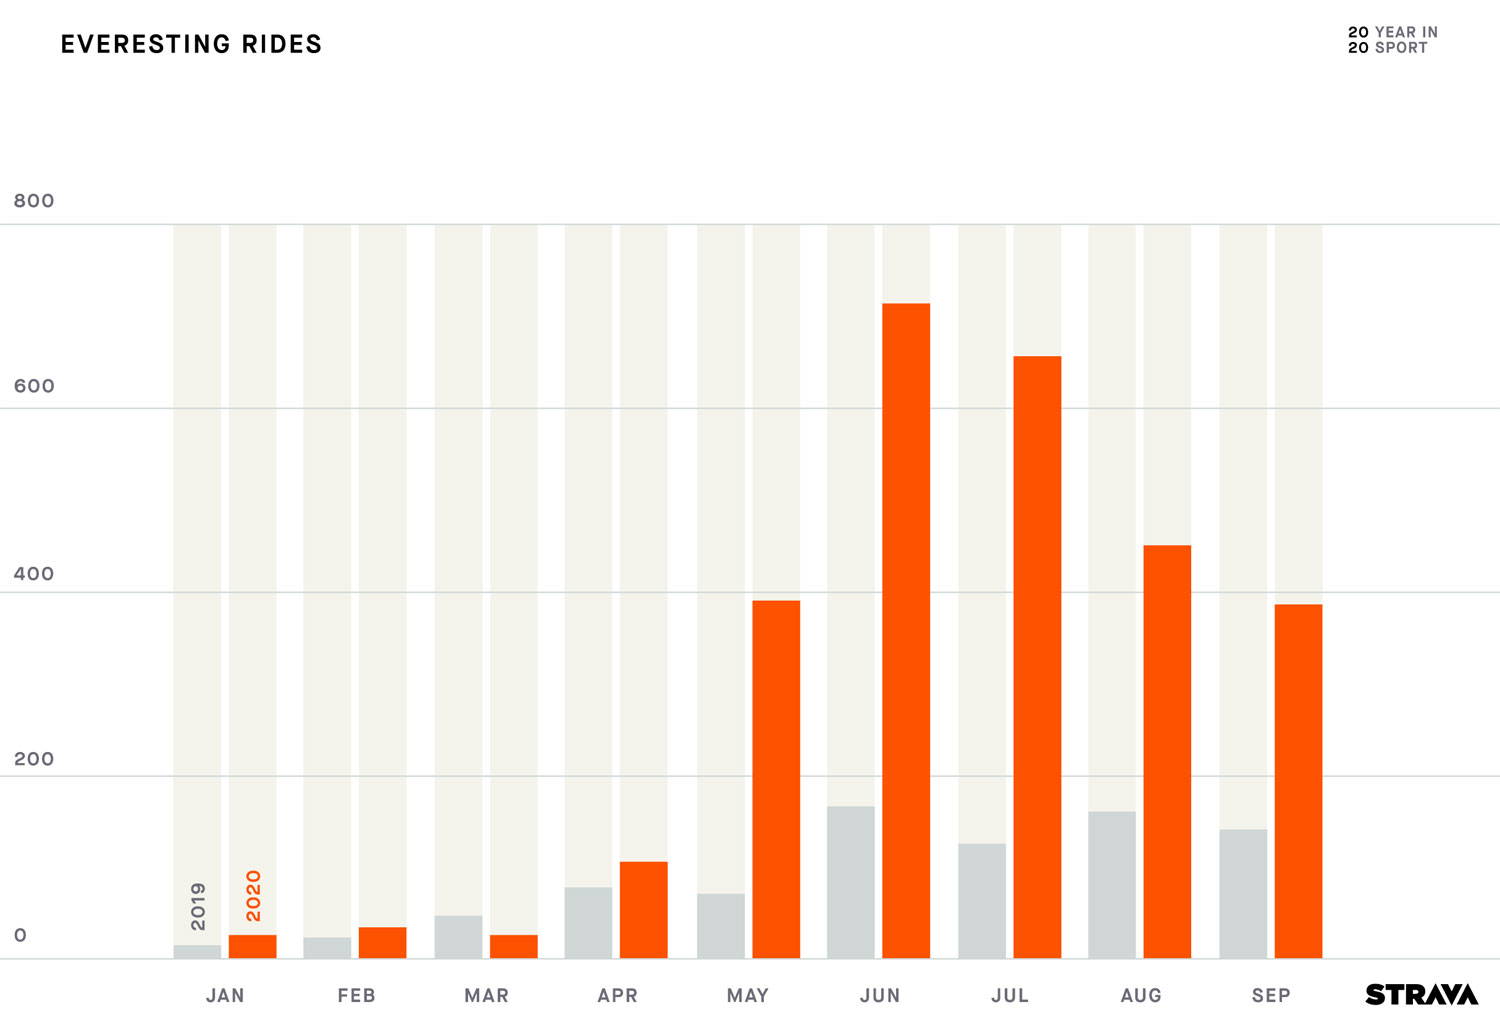
And when you can’t compete at races & gran fondos, why not try an Everesting to push yourself? This year’s trend for amateur & pro cyclists looking to push themselves was to climb 8849m / 29,032ft in a single ride repeated up one climb. More than 700 amazing idiots impressive athletes successful completed Everesting attempts in June alone on Strava in 2020, with an average time of 17h13m48s for women and 16h47m40s for men. Wow.
And while many of us limited out rides & runs with other people… social engagement, virtual competition and community continued to boom – often replacing group rides themselves. The number of virtual clubs more than doubled over the year, with the number of online club members more like 3x last year’s figures.
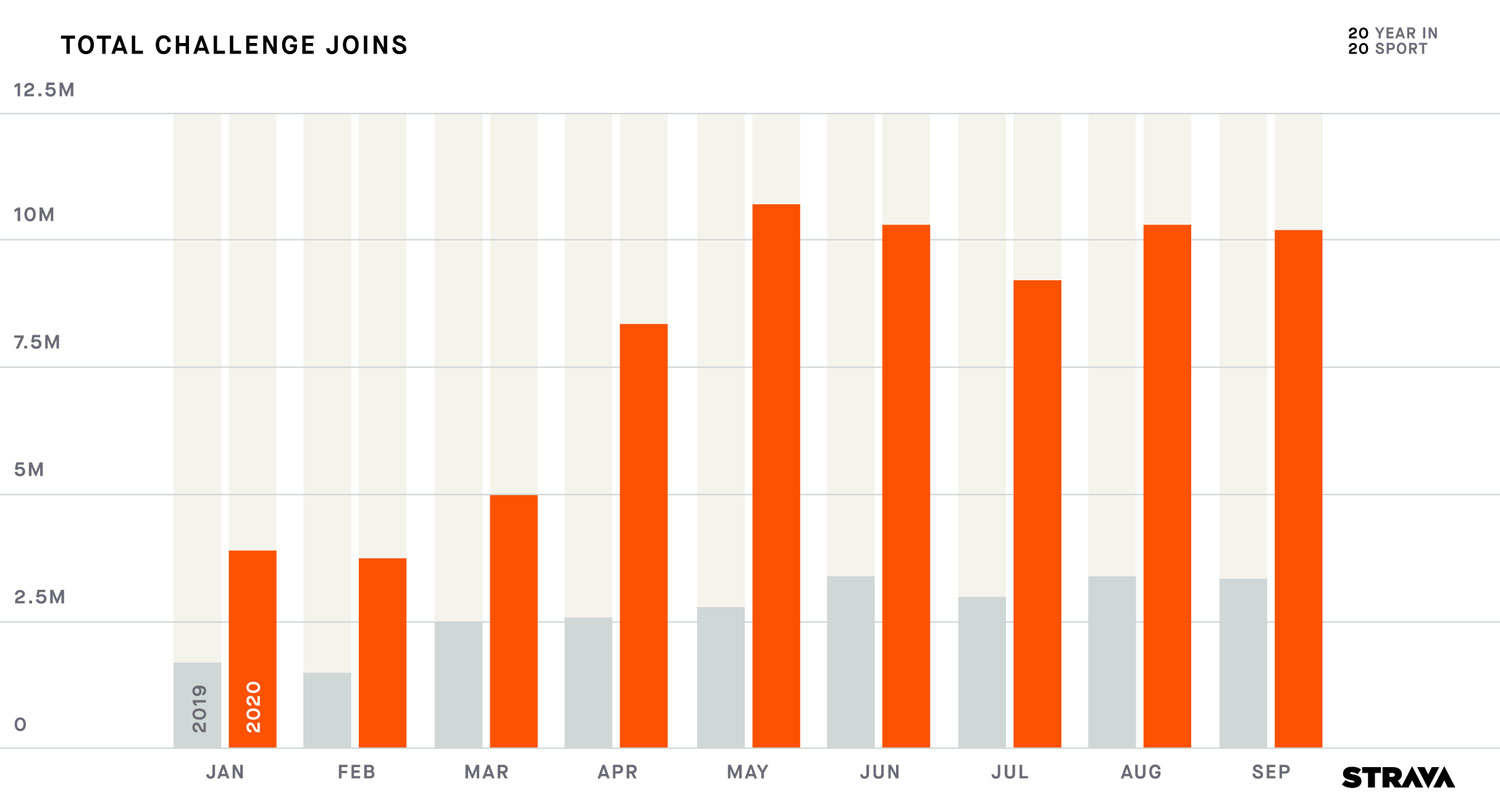
Total challenge joins on Strava exceeded 71 million between January to September, more than doubling challenge engagement vs. last spring & summer.
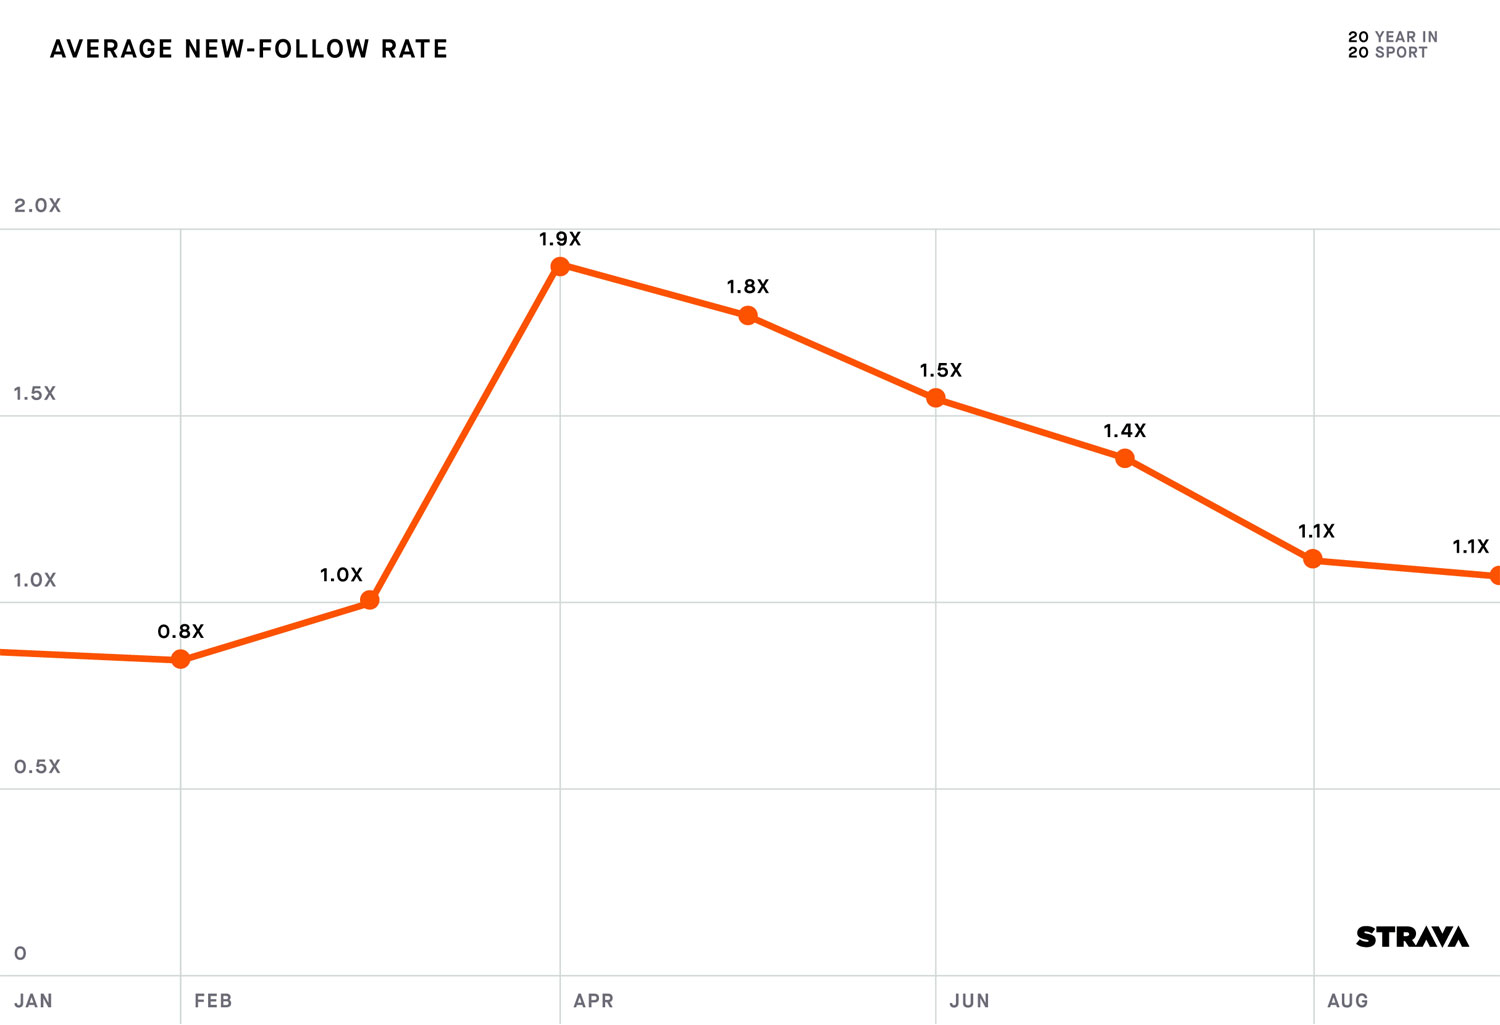
And when we couldn’t ride together – as Strava puts it – perhaps ‘the most human’ increase in the days of coronavirus… we just increased our virtual social connections by 1.9x. “The average athlete followed almost twice as many people this April than they did last year. Throughout 2020, everyone struggled to feel connected to those they care about. We hope that Strava helped even the tiniest bit to bring people together.”
It wasn’t just a 1.8x boom in outdoor cycling & 1.9x in outdoor running uploads, Strava also noted a significant 3x increase in outdoor walking, 1.9x increase in the number of hikes, and more than 2x increase in indoor workouts and outdoor boating sports.
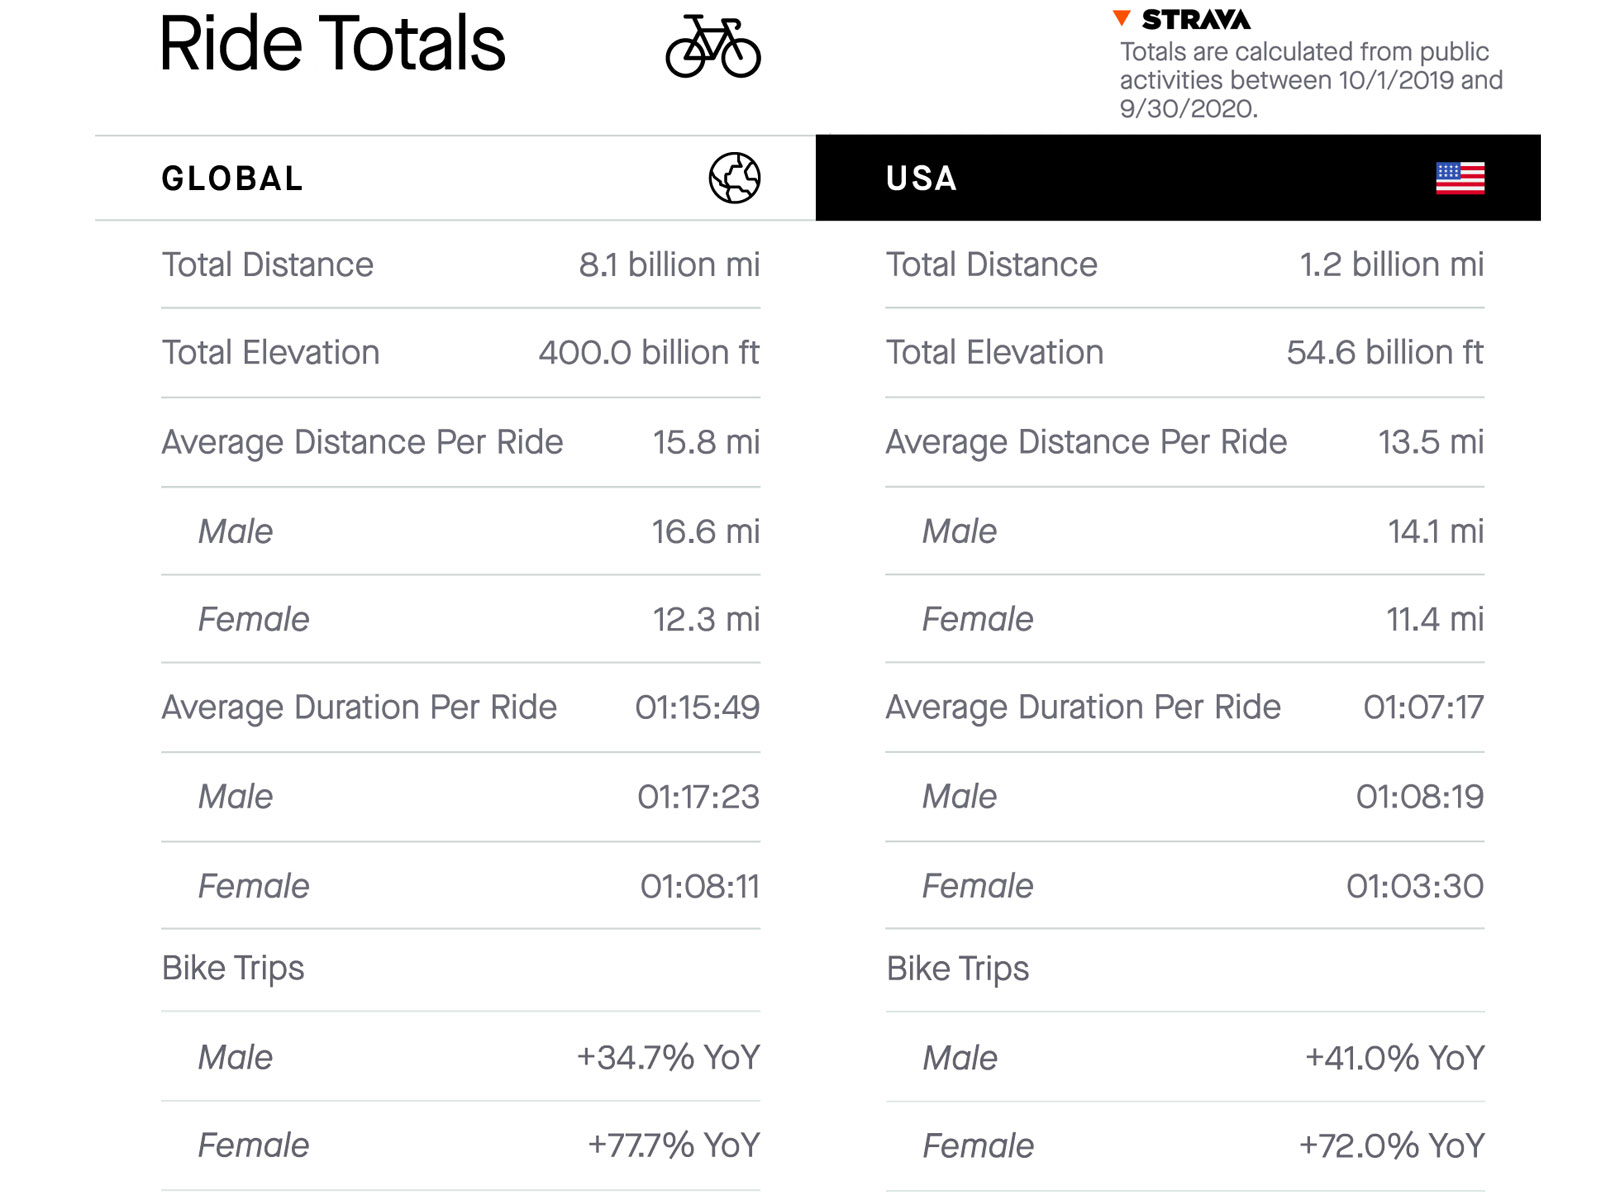
2020 Strava cycling ride totals
In the end, cyclists around the globe racked up 8.1 billion miles with 400 billion feet of elevation gain, while runners added another 1.9 billion miles and 94.5 billion feet of climbing. Riders in the United States contributed 1.2 billion miles cycling, and 387 million miles running.
