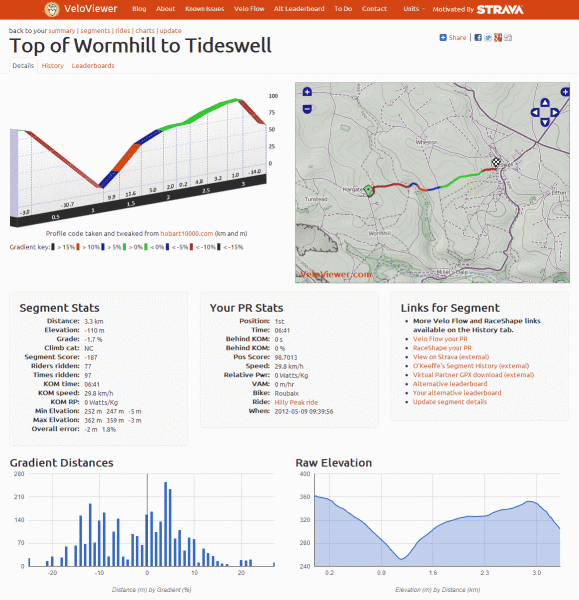
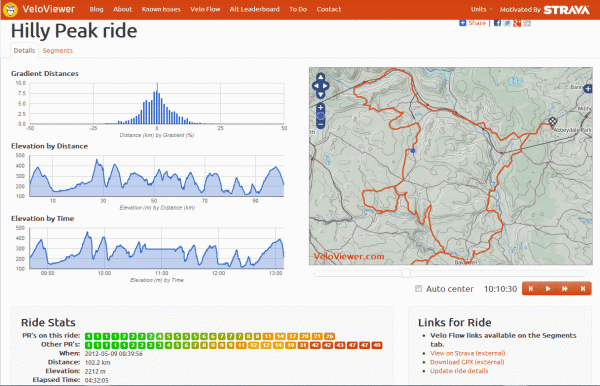
Most enthusiasts and racers alike have, for the most part, become comfortable with Strava. And like it or hate it, it dominates the way cyclists track their efforts. It has set the standard on how we track our performance as well as our mortal enemy’s. Velo Viewer takes your existing Strava data straight from the source, then charts it with a much wider view of your efforts as well as those of others.
As overwhelming as it may seem at first, it ends up making your training and ride data so much simpler to understand. For instance, it shows you your previous efforts on a segment so you can monitor how much you have improved, (or how much more work you need to do coming off that Winter break), a 3D Route viewer that really puts your ride into perspective. They even have their own “Veloviewer Score” that rates your performance based on your best results within individual and combined segments. And that’s only the beginning…
From Velo Viewer’s Site:
VeloViewer (formally StravaViewer) started life as a Windows Phone application to allow me to view my Strava data on my not quite so popular model of phone and to try and plug some of the holes in Strava’s own excellent website. Hopefully at some point Strava will plug these holes (and give some more nice summary api’s) and make this website obsolete. As well as showing a history of rides I wanted to see a full, orderable list of my Strava segment placings.
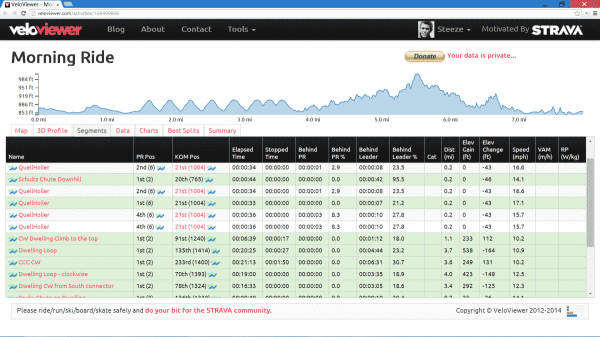
The site is made up of six main pages: Summary, Segment List, Ride List, Charts, Update and Signature Image along with Ride Details and Segment Details pages. Also there is the Alternative Leaderboard and VeloFlow pages.
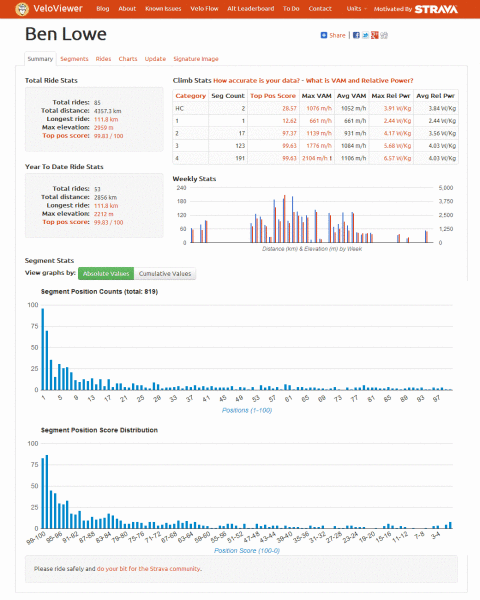
Overall, yearly and weekly stats and charts including all your best climbing achievements.
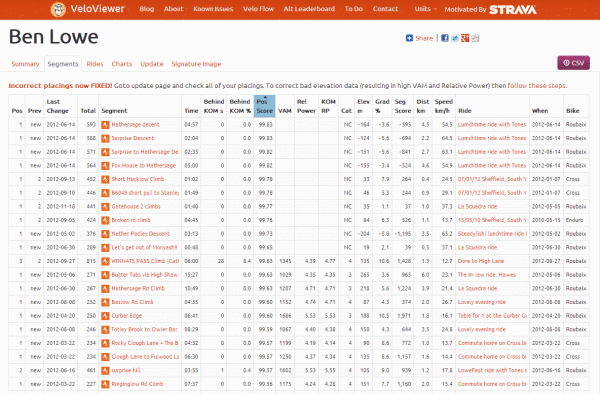
Here it is, your Strava segment history all in one place! Fully sortable list of all your segments ever uploaded and displayed with all the metrics you could want.
So what are all those fields?
- Pos – your position on the segment the last time you updated. Note: there is currently a bug in the Strava API resulting in some more optimistic placings where it doesn’t add aditional placings for tied athletes ahead of you.
- Prev – the position you had on your last effort in that segment.
- Last change – the date your last placing change occurred. The colour reflects both whether that change was up or down (green or red) and also how long ago it happened (how saturated the colour is).
- Total – total number of riders that have completed this segment.
- Segment – Name of segment with main link to VeloViewer Segment Details page, also a direct link to the corresponding page in Strava.
- Time – Your PR’s moving time (rather than elapsed time).
- Behind KOM s – the time your personal best is currently behind the current KOM. Ordering by this column gives a good list of segments that you could potentially target for easy(ish) KOM wins.
- Behind KOM % – percentage of time your personal best is currently behind the current KOM.
- Pos Score – Out of 100, how this placing stacks up against other places.
- VAM – or Mean Ascent Velocity is a good indicator of effort without accounting for wind/rolling resistance.
- Relative Power – This attempts to also take into account wind/rolling resistance and displays it in Watts/Kg of body weight. Higher (longer) climbs produce more accurate results.
- KOM RP – the relative power of the KOM, see if it’s within your limits or if you think they were driving a car at the time.
The other columns’ data is fairly obvious with the ride link taking you to the VeloViewer Ride Details page.
Three of the last four columns are worth a closer look:
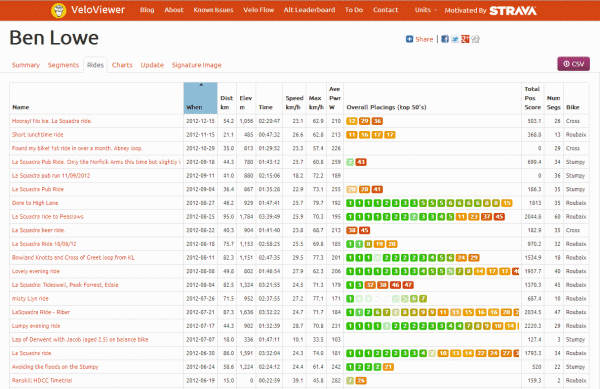
- Overall Placings – This shows a list of your segment PR’s (Personal Records) that where acheived on this ride, basically, ordering by this column will show you your most successful Strava rides. The colour indicates the position (1-50) and the saturation of the colour indicates the number of riders for that segment.
- Total Pos Score – This totals up your segment position scores for the PR’s on this ride.
- Num Segs – the number of segments completed on this ride (not just yours).
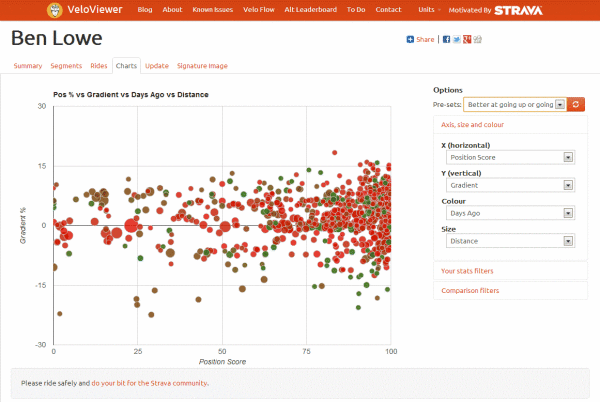
If you like your graphs then you’ll like this. Pick and choose your variables it’ll graph them against each other for big fat visuals of performance.
These two pages (above and below) show the potential for more visualization. Some items are sort of in beta and could change with ongoing upgrades.
All of the data is worked up to create your VeloViewer score, which goes far beyond just comparing your position on a segment. It takes your position for the top 25% of your segments and puts your overall effort into perspective by scoring it based on the number of other riders who’ve also done that segments. It even weighs the number of folks who’ve done each segment, putting more emphasis on segments with more completions than those with fewer. After all, it’s a bit more meaningful when you’re holding the record over a 1,000 riders than a segment with only three.
