While in Palo Alto for the Specialized Turbo Vado e-bike launch, I made a side trip to their Morgan Hill, CA, headquarters. The whole thing is impressive, and throughout this week you’ll see more of it, but I’m starting with the Win Tunnel.
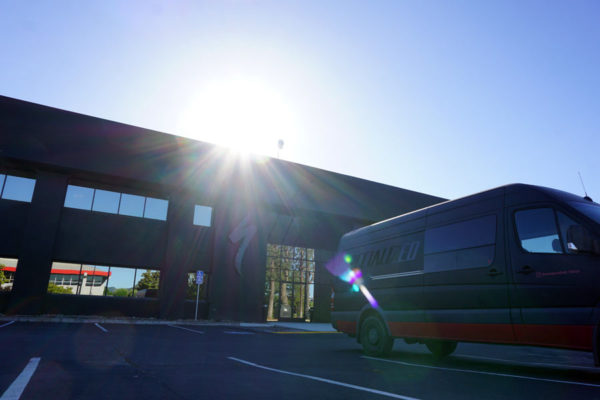
It’s housed in the rear-most building, which is the original Morgan Hill headquarters. Mike Sinyard moved the company from San Jose and grew it inside these walls until it was bursting. Once they’d moved everyone to a new, larger building just in front of this one (you can see the red trim of it in the window’s reflection), this one was gutted to make room for the Win Tunnel. Not only did I get to see what it’s like to stand inside while it maxes out at 70mph (video on our Facebook page), I learned why virtually every wind tunnel test produces results at 40km per hour or more…
I don’t know about you, but I rarely (read: never) sustain 24.85 mph over more than a few hundred feet. Unless it’s all down hill. But that’s what 40km/h translates to, and that’s the number we see in virtually every bike or wheel manufacturer’s aero claims. Why? Turns out, there’s a good reason. But first, a little tour.
Enter the building, which requires a key card, and you’ll see the front end of the tunnel. This is where the air is sucked in…
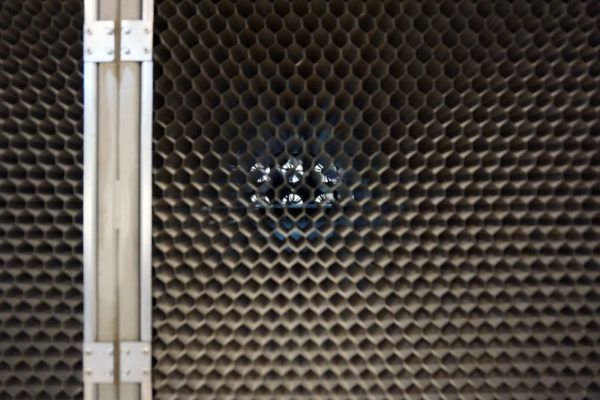
…through a 20″ deep honeycomb wall. The divisions are paper thin and easy to bend, so it’s best not to touch them. This system gets the air moving into the tunnel in a straight path with minimal turbulence. Normally, a wind tunnel like this would cost many millions more than even a Specialized-sized company could afford. But, based on conversations over drinks at the Vado launch, I learned that it came about thanks to fortuitous hires of people skilled in such things and beneficial friendships with folks outside their company that just seemed eager to impart knowledge.
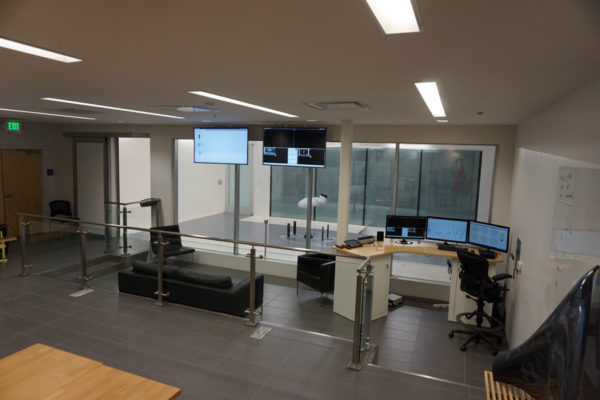
Entry to the wind tunnel comes through the command center.
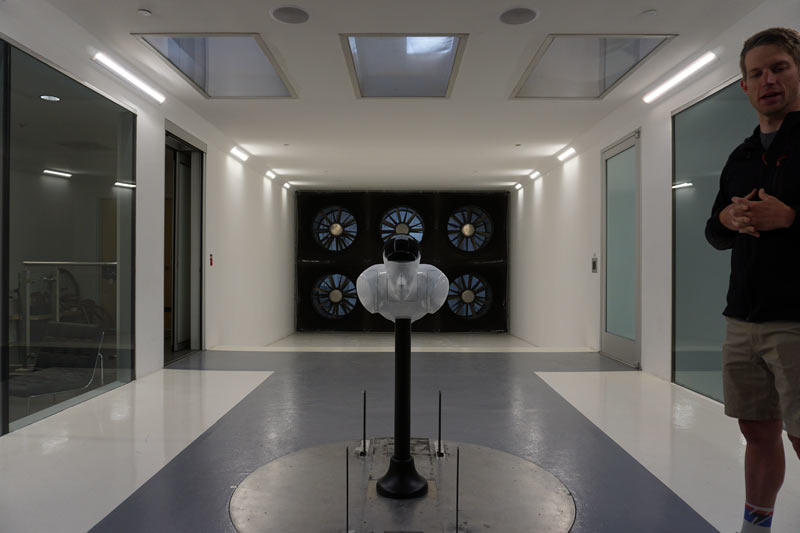
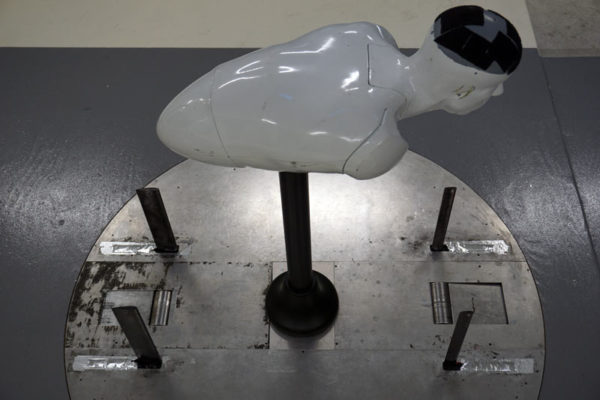
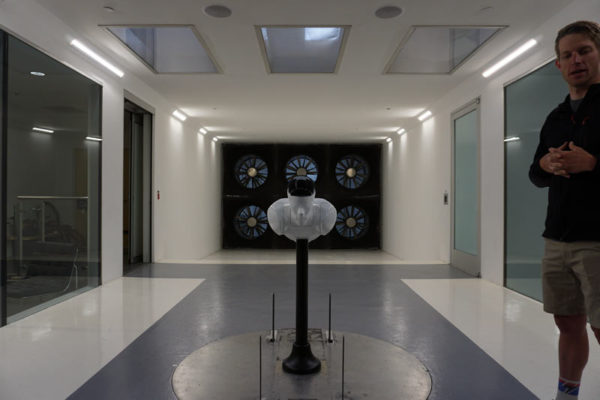
From the inside, where the bike sits, the honeycomb wall just looks like a big screen. The fans are in the back and pull air through the tunnel so they’re not sending messy, turbulent air across the bike and rider. The sensor gauge sits atop a platform with its own channels for air to move through, which they say helps reduce any boundary layer air situations that could skew results.
The strain gauges that attach to the axle are essentially like weight scales turned on their side. As the wind pushes the rider back, it measures how much “weight” is created, which is calculated into grams of drag. From there, they can figure out all sorts of things. The platform rotates, letting them simulate yaw (cross winds), and at its base well underneath the platform, it’s about twice the diameter you can see here.
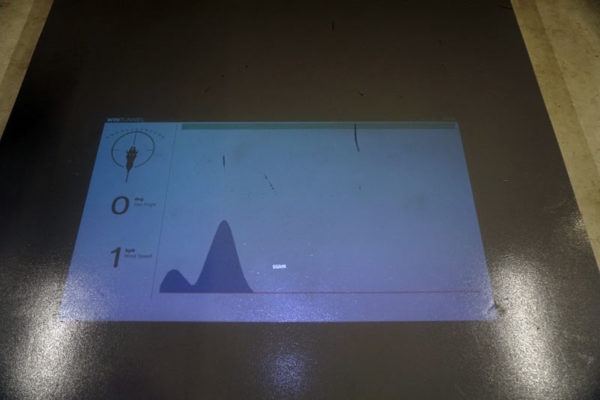
Projected on the floor in front of the rider is wind speed, angle and the amount of drag. The latter is shown as a graph over time, and the blue hills are from them pressing down on the sensor.
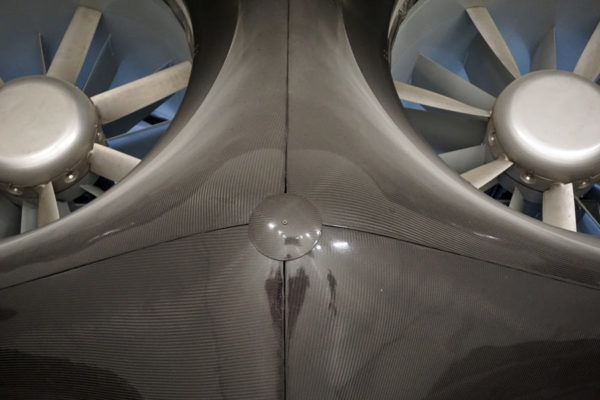
At the back are six giant fans. Here, too, is where they were able to cut costs. They used readily available commercial HVAC fans that are designed to run continuously, day in and day out. That means they’re low maintenance, and repairs and replacements are easy. Compare that to custom, one-off high speed fans that need custom, one-off replacement parts and cost many multiples more and you see how they used off the shelf parts to their advantage. The carbon fiber surrounds were laid up in house and custom made. The first piece didn’t have a smooth enough finish, so they keep that in the office for star athletes to sign when visiting the tunnel.
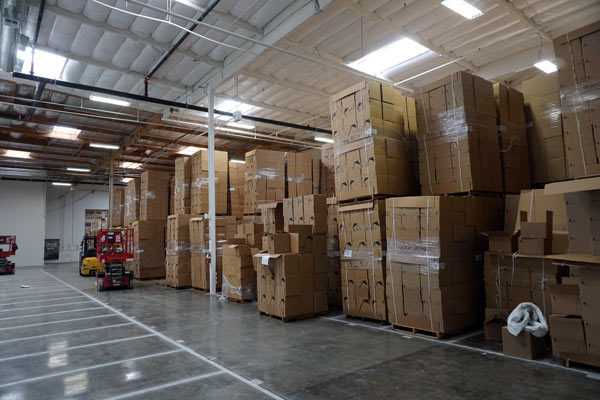
The back and side of the building are used for their Purist water bottle finishing. They’re blow molded elsewhere in California, then have their glass-like Purist interior coating applied in house because they didn’t want to share that technology. They also print them in-house with non-toxic inks, assemble the caps (some of those parts are made elsewhere), and pack ’em up in these boxes.
Now, about those aerodynamics numbers…
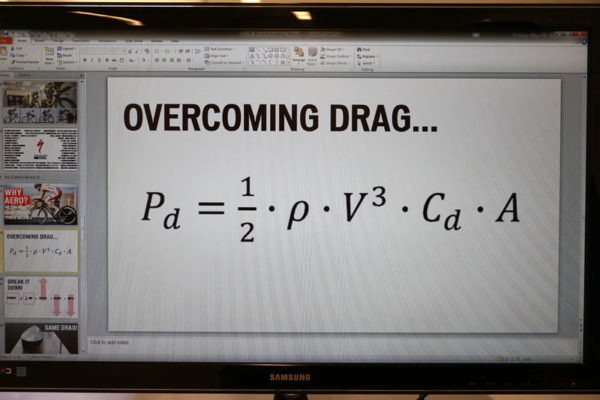
The formula above basically translates to this:
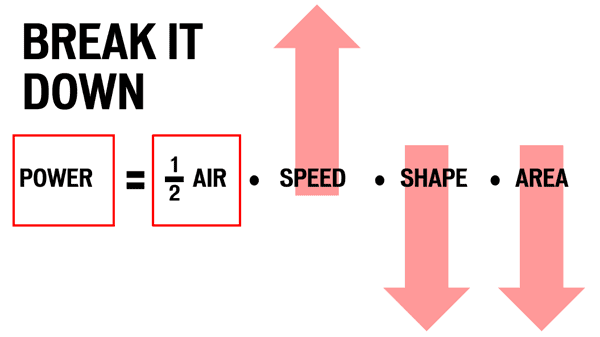
Power = 1/2 x Air Density x Velocity³ x Coefficient of Drag x Area. The Cd•A part of that doesn’t change unless you change your position or frontal area, so that’s considered a constant when figuring out the power required to overcome that drag. Velocity and Air density obviously change, and since Velocity is cubed, the faster you go, the bigger impact it has on the power number. Which is why it takes exponentially more power to continue to increase your speed. Air Density, represented by Rho (ρ), is calculated with barometric pressure, relative humidity and temperature (more on that here). Change that and you change how easy or hard it is to plow through it.
Note there’s no mention of “grams of drag”. Because that number is variable, and it doesn’t matter when calculating how much power you need. Instead, the formula above shows how much power you need to move at a certain speed with a fixed Coefficient of Drag Area. Some of the exact terms might be minced thanks to my rapid note taking, but the principles are what’s important: Reduce your frontal area or optimize your shape, and you need less power to go fast.
And here’s why that gives meaning to all of those “…saves 50 seconds over a 40km time trial at 40 50km/h…” claims we see on so many products’ sales sheets. Because the speed doesn’t matter, the benefits are basically the same. Do the math and you’ll see that the differences in time saved over 40km varies very little whether you’re doing 12mph or 30mph. Your total time longer, for sure, but your time savings will likely be within a few seconds of the faster rider. (UPDATED: Corrected to testing at 50km/h, per followup with Specialized)
If you want to plug your numbers in, Specialized’s aerodynamics engineer and road product manager Cameron Piper (who also manages the Win Tunnel) says an average sized fit cyclist has a CdA of 0.28 to 0.35 m², and an “average” day has a Rho around 1.15 to 1.18. You’ll have to put your other numbers in to figure out power…or velocity. He says that, roughly speaking, for every 0.001m² reduction in CdA, you can expect to save about 4 seconds per 40km.
So, if no one outside of the pro peloton is really holding a 50km/h average, why do they test at those speed? Piper says it delivers better data. The higher speeds amplify the inputs, providing higher resolution data that paints a clearer picture. For Specialized in particular, it’s done to match up better with data coming from high speed wind tunnels that other brands are using. In the Win Tunnel, 50km/h winds are more than half it’s top speed. At tunnels used for testing F1 cars and airplanes, 50km/h is barely above idle, and about the minimum speed those facilities are able to use to produce good data. (UPDATED: Corrected from 40km/h to 50km/h)
The takeaway: Next time you see those talking points here on Bikerumor, just know that you’re likely to see similar time savings whether you’re a pro or not.
