In the game of getting better and faster on your bike, getting a coach and training with power are two of the more effective ways to play it. Now, there’s a third tool available – Motion Analysis.
LEOMO is launching with a complete system for cyclists that’s not only very well thought out, but also very much upgradable. Why? Because as sophisticated as it is, even they haven’t figured out all the ways you can use it. More on that in a minute. Let’s start with the Type-R system details. It captures your hip, thigh and foot motion and measures it to show the quality of that movement. They say we, as humans, aren’t always able to move exactly how we think we’re moving. And coaches aren’t always able to communicate movement instructions well enough. That, or athletes aren’t interpreting the coach’s feedback properly. More likely, it’s some combination of the two. By digitally visualizing the data and being able to show an athlete exactly how they’re moving in space, everyone gains a better understanding of where they can improve…
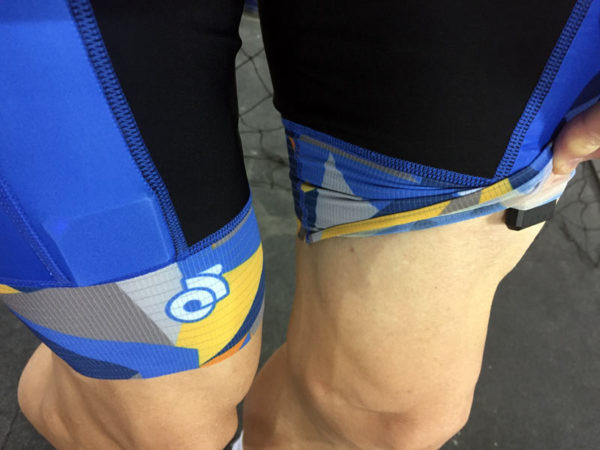
LEOMO uses five sensors to capture rotation and acceleration in three planes (X / Y / Z, or Pitch, Yaw and Roll) at your thigh, foot and heel, and pelvis. The sensors are small and are placed at the sacrum (back of pelvis, just above the tail bone), feet and lower thighs.

It captures the data in real time and very affordably, particularly considering doing this before LEOMO required video motion tracking in a lab environment. Which isn’t the same as measuring it out in the real world, and that’s another benefit of LEOMO…you can wear it on your normal rides, outside, so you’re capturing the real movements you make every day.
The cycling computer has built in ANT+, Bluetooth and WiFi, so it’ll connect to your power meter, speed/cadence sensors and other devices, and GPS will capture your speed and route, too. So, you get all the usual metrics on top of your motion analysis. The touch screen is large and worked well. For a freshman effort, the UI/UX is incredibly well thought out.
The standard mount/head unit combo has a built-in one hour battery. Snap on the auxiliary battery (left) and you gain nine more hours. The headunit weight is 84g with small battery, 90g with the large one, and has 6GB of usable storage for your rides. It has a built-in accelerometer and barometric altimeter, too.
Once you hit start, which is one of just two physical buttons located on the mount just below the screen, the data fields fill the screen. Touch and hold one for a second and it’ll expand to show that one single metric full size (shown on bottom, expanding the lower left field to full screen Dead Spot circles).
You can customize their placement should they develop analysis metrics for other parts of your body. That, along with a smaller screen option and wrist mount, shows they’re playing the long game with a lot of future-proofness built in.
Their smartphone app lets you customize each screen, setting them up to see only what you want to see and set up multiple screens. There are a ton of metrics you can choose from.
The motion sensors, shown above clipped into the shoe mounts, are small and light (12g each) and connect to the head unit via Bluetooth.
The design of the entire system is impressive. The sensor charging cube snaps them in on all sides to charge them all at once. Once they’re charged, the corners illuminate indicate their intended position by use of different colored lights.
IMAGE – PSI GRAPH
LEOMO Type-R captures five main metrics, called MPI (Motion Performance Indicators):
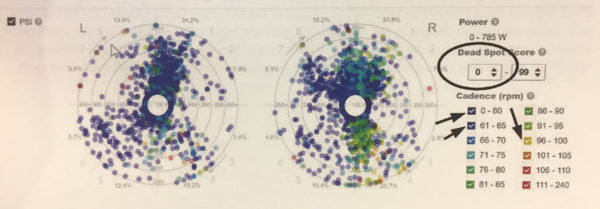
1) Dead Spot Score measures the smoothness of your pedaling motion. Dead spots are where you’re not smooth, and the magnitude of your dead spot is represented by an increasingly larger circle on a circular graph. It’ll also show as a sine wave, where smoother equals better. This metric is plotted on a Pedal Stroke Intelligence diagram that shows where, how often and at which power outputs your dead spots are. (this is the circular graph with dots)
2) Pelvic Tilt – shows how much you’re leaning forward, and how much your hips are rocking or twisting.
3) Leg Angular Range measures how much your leg is extending, which helps identify leg length or flexibility imbalances. It should also be able to show if your knees are moving inward or outward, however they weren’t showing that on screen yet.
4) Foot Angular Range shows how much your heel moves up and down throughout the pedal stroke.
5) Foot Angular Range (Q1) focuses on the foot and heel motion only from 12 o’clock to 3 o’clock to show any delays in your stroke at the top.
You’ll be able to see most of this on the GPS cycling computer’s screen if you want, but the real value comes when it’s uploaded to the cloud and displayed on charts and graphs. One of the main ones is the PCD Map, which shows where you are most efficient and in which zones you spend the most time. Above, the darker color means it has more sample data to pull from, which means that’s where you’re spending most of your time. So, if you’re getting a dark green, that’s probably where you are most of the time and where you’re most efficient. The darker red sections mean you’re spending a lot of time there but are not efficient. It could be that those segments are where you’re warming up, but having that data lets you know where you should try to be. You could end up with different maps for climbing, flat racing, time trials, etc.
It measures the position of each sensor 100 times per second, and vibrations, road noise, etc., is filtered out by their algorithm. All metrics show in real time on the display, and is uploaded to their web app after the ride for deeper analysis.
TARGET MARKET
The initial target market is coaches because they’ll be best able to interpret the data and provide useful feedback to you, so they brought two well known ones to the launch to explain.
Neal Henderson, founder of Apex Coaching, which creates the workouts for The Sufferfest videos, says the value lies not just in being able to show an athlete their patterns in real time, but also helping them be more efficient. It can also identify imbalances and weaknesses, making it easier for them to address those deficiencies and correct course before they end up causing injury.
For athletes with a known asymmetry, it can show how the athlete is compensating for it and help them work out the best compromise.
Lastly, it shows what happens to you when you’re fatigued. Does your form fall apart? How does that affect your power output? All things they can now assess and address with better training and preventative exercises.

Hunter Allen, founder of Peaks Coaching Group and co-founder of Training Peaks, has helped write the training book for coaches to use LEOMO’s data. He says LEOMO works as an outstanding remote coaching tool. Because all of the motion data sits in the cloud after your ride, he (or any other coach) can review it and provide feedback and change training and workouts to improve form.
He looks at your “Pedaling Print”, which is like a finger print that’s unique to you, to see where your dead spots are, where you’re creating power (or not) and what your optimal cadence and gear ratios are. More specifically, he can now see where your dead spots are minimized as you change your cadence and cross check that against power output.
Allen created the PCD (Power Cadence Dead Spot) score to put a simple number on it and graph it with cadence on one axis and power on the other, with the PCD score in the middle. This chart becomes your “Pedaling Print”. The takeaway is what cadence at which you’re most efficient, meaning where you have the least dead spot.
From a coaching standpoint, it lets them provide gear selection advice, positioning and movement advice, and guidance on aero positions. He says all of this allows the coach to have a better prediction of fitness, which simply means that if a rider says they want to peak for a certain event, they’re better equipped to make that happen.
We had a chance to ride it, but haven’t received our ride data yet, so look for a followup post with that.
LAUNCH PLANS & PRICING
LEOMO is launching for cyclists because their founders are cyclists and triathletes. Product should be available in very limited quantities early in 2017. The plan is then to introduce it for runners late 2017, and followup with other options like swimming, weight lifting and maybe even football in 2018.
They’ve also created the Institute of Motion Analysis, an independent entity to study all of the data that’s now available and figure out all the ways it can be used, the solutions it offers and help answer new questions that arise. It will be brand agnostic, so other companies’ motion analysis systems and data will be included and evaluated. The end goal is to help develop practical applications for the data and answers, which includes improved coaching techniques and (hopefully) improved athletic performance.
Final retail price will be between $700-$800. There are some early beta programs available, initially only offered by referral for the first 100 units at $399, and then in limited quantities ranging from $499 to $599. The Open Beta Program by invitation only, and you can inquire on their website.